
Fig. 6
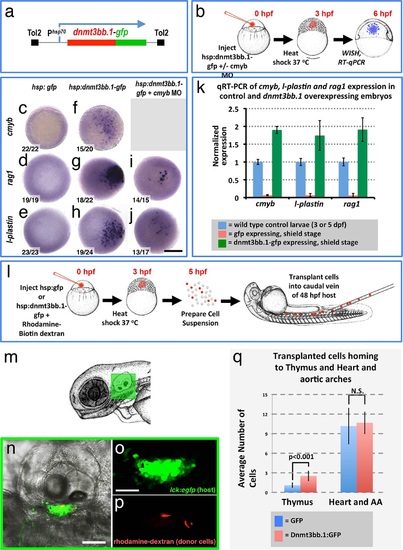
Dnmt3bb.1is sufficient for HSPC and downstream lineage gene expression. (a) Schematic diagram of the Tol2(hsp70:dnmt3bb.1-gfp) transgene used for ubiquitous heat shock-inducible expression of dnmt3bb.1-gfp fusion protein. (b) Camera lucida drawing showing the experimental protocol employed for early embryonic induction of dnmt3bb.1. One cell-stage embryos are injected with Tol2(hsp70:dnmt3bb.1-gfp) transgene +/- cmyb morpholino (MO), raised to 3 hpf (mid-blastula stage), heat shocked, allowed to further develop to 6 hpf (shield stage), then either fixed for whole mount in situ hybridization (WISH) or collected to prepare RNA for RT-qPCR. (c-j) Whole mount in situ hybridization of 6 hpf control Tol2(hsp70:gfp) transgene-injected (c-e), Tol2(hsp70:dnmt3bb.1-gfp) transgene-injected (f-j), or Tol2(hsp70:dnmt3bb.1-gfp) transgene plus cmyb morpholino (MO)-injected (i,j) zebrafish embryos, probed for cmyb (c,f), rag1 (d,g,i), or l-plastin (e,h,j). (k) Quantitative RT-PCR analysis of cmyb, l-plastin, and rag1transcript levels in positive control untreated 3 dpf (for cmyb and l-plastin) or 5 dpf (for rag1) larvae (blue columns), negative control shield stage (6 hpf) embryos injected with a Tol2(hsp70:egfp) transgene and heat shocked at 3 hpf (red columns), or shield stage (6 hpf) embryos injected with an Tol2(hsp70:dnmt3bb.1-egfp) transgene and heat shocked at 3 hpf (green columns). (l) Schematic drawing showing the experimental protocol employed for early embryonic induction of dnmt3bb.1-gfp and subsequent transplantation of cells into the circulation. One cell-stage embryos were injected with Tol2(hsp70:egfp) or Tol2(hsp70:dnmt3bb.1-egfp) transgenes, raised to 3 hpf (mid-blastula stage), heat shocked, and allowed to develop to 5 hpf, at which point the embryos were dissociated and cell suspensions was prepared. Dissociated cells were injected into the circulation of 48 hpf host larvae using a borosilicate needle without filament. (m) Camera lucida drawing of a 72 hpf zebrafish embryo with a green box noting the approximate regions containing the thymus. (n-p) Confocal images of a 5 dpf Tg(lck:GFP)cz1 host animal showing transplanted cells colonizing the thymus. Transmitted light image (n), green fluorescent lck:gfp positive host thymus (n,o), and red fluorescent rhodamine-dextran positive donor cells populating the thymus (p). (q) Quantitation of the number of control GFP and dnmt3bb.1-GFP expressing cells in the thymus and heart/aortic arch region. Images in panels c-f,r,s are dorsal views and panels n-p are lateral views. Scale bars = 150 µm in c-j, 25 µm in n, 10 µm in o. |