
Fig. 5
- ID
- ZDB-FIG-151110-4
- Publication
- Kimmel et al., 2015 - Diabetic pdx1-mutant zebrafish show conserved responses to nutrient overload and anti-glycemic treatment
- Other Figures
- All Figure Page
- Back to All Figure Page
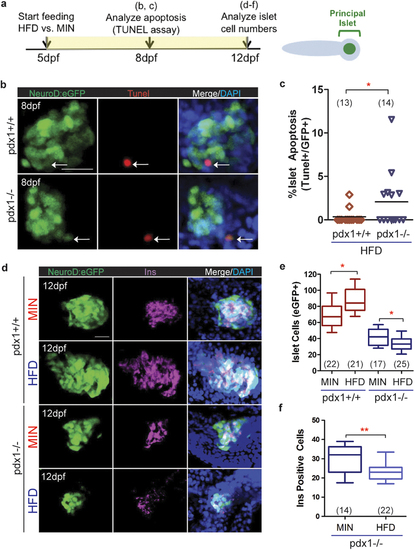
Feeding effects on beta cell induction and viability in pdx1 mutants. (a) Timeline schematic of larval feeding and analyses. (b) MIPs of confocal images of the principal islet from NeuroD:eGFP+ control (top) and pdx1 mutant (bottom) larvae fed HFD from 5–7 dpf, and analyzed at 8 dpf by TUNEL labeling and immunostaining for GFP. Nuclei were counterstained with DAPI (blue). Arrows indicate eGFP+/TUNEL+ islet cells. Scale bar, 20µm. (c) Quantitation of the percentage of apoptotic cells (TUNEL+/GFP+) in the principal islet of wild type and mutant larvae as shown in (b). Line indicates median. *p < 0.05, Mann-Whitney, one-tailed t-test. (d) Representative MIP confocal images of islets from 12 dpf Neurod:eGFP+ wild type and mutant larvae fed powder (MIN) or high fat diet (HFD) from 5–11 dpf, followed by immunostaining for GFP and Ins (magenta). Nuclei were counterstained with DAPI (blue). Scale bar, 20µm. (e) Number of NeuroD:eGFP+ islet cells in 12 dpf larvae treated as in (d). For pdx1+/+ and pdx1-/-, comparing MIN to HFD treated, *p < 0.05, Mann-Whitney, two-tailed t-test. (f) Number of Ins-expressing cells from mutant larvae as in (d) (**p < 0.01; t-test). In box plots, the median is indicated, boxes span the 25th to 75th percentile, whiskers the 10th to 90th percentile. In all graphs, number of larvae analyzed per group (combined from 2 or more independent experiments) as shown. |