
Fig. 2
- ID
- ZDB-FIG-151102-51
- Publication
- Jahr et al., 2015 - Hyperspectral light sheet microscopy
- Other Figures
- All Figure Page
- Back to All Figure Page
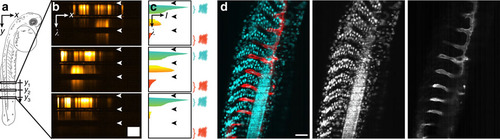
Image formation and virtual filtering. (a) Schematic drawing of a two days post fertilization zebrafish embryo imaged laterally. (b) Typical x, λ-data sets acquired along three different lines in a Tg(h2afva:h2afva-GFP,kdrl:Hsa.HRAS-mCherry) zebrafish embryo. Spatial information is displayed horizontally, spectral information vertically. Dark horizontal stripes (arrowheads) were caused by the QuadNotch filter blocking scattered illumination light. Scale bar, 100nm (spectral) × 100µm (spatial). (c) Spectra were extracted from the x, λ-data sets by integration along the x axis. From the spectra, regions that could be assigned unambiguously to a colour channel were chosen and integrated (′virtual filtering′). (d) Reconstruction of a dual channel image with cyan (left): 475-555nm, red (right): 601-718nm. Scale bar, 100µm. |