
Fig. 7
- ID
- ZDB-FIG-151026-4
- Publication
- Mitchell et al., 2015 - Retinoic Acid Signaling Regulates Differential Expression of the Tandemly-Duplicated Long Wavelength-Sensitive Cone Opsin Genes in Zebrafish
- Other Figures
- All Figure Page
- Back to All Figure Page
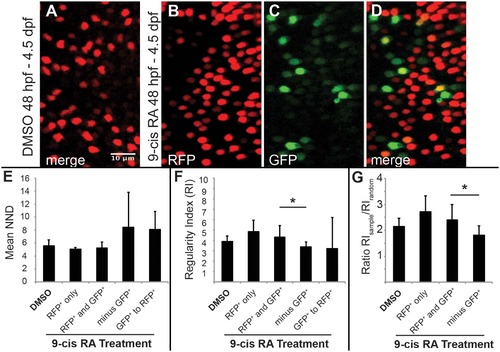
Two-dimensional pattern analysis of LWS cones in LWS:PAC(H) embryos exposed to RA: Retinoic acid induced LWS1-expressing cones do not disrupt the LWS2 cone mosaic. Regions from confocal images at 60X magnification obtained from whole mounted LWS:PAC(H) eyes treated with DMSO or 0.3 µM 9-cis RA 48 hpf to 4.5 dpf were used for pattern analysis. A-D. Representative regions used to determine the mean nearest neighbor distance (NND) and Regularity Index (RI) of LWS cones in control and 9-cis RA-treated eyes. Regions from DMSO treated retinas expressed only LWS2:RFP cones (red) (A), while regions from 9-cis RA treated retinas (B-D) contained RFP+ (red), GFP+ (green), and RFP+/GFP+ (yellow) cones. B-D. Images showing RFP signal only (B), GFP signal only (C), and merge of both signals (D) in regions of 9-cis RA treated retina. Graphs of NND (E, left three bars) and RI (F, left three bars) corresponding to regions from DMSO treated (DMSO) and 9-cis RA treated retinas. 9-cis RA treated retinas were further divided into groups: regions of retina where only RFP+ cones are present (RFP+ only), and regions containing both RFP+ and GFP+ cones (RFP+ and GFP+) when all labeled cells (regardless of RFP or GFP expression) are treated as the same cell type. Graphs also indicate NND (E, right two bars) and RI (F, right two bars) for 9-cis RA treated retinas when GFP+ cones are subtracted from the RFP+ and GFP+ mosaic (minus GFP+) and when the pattern of GFP+ cones to RFP+ cones (GFP+ to RFP+) is analyzed. G. Graph showing the ratio of RI from each indicated region (RIsample) with that of the average RI from 1000 generated random samples of the same number of cells (RIrandom). The asterisk (*) in F and G indicates p<0.05 for a two-tailed Student’s t-test between the indicated groups. Error bars represent standard deviation (n = 7 regions from 4 eyes, DMSO; 6 regions of RFP+ only and 10 regions RFP+ and GFP+ from 6 eyes, RA). |