
Fig. 2
- ID
- ZDB-FIG-150518-19
- Publication
- Williams et al., 2015 - An In Vivo Chemical Genetic Screen Identifies Phosphodiesterase 4 as a Pharmacological Target for Hedgehog Signaling Inhibition
- Other Figures
- All Figure Page
- Back to All Figure Page
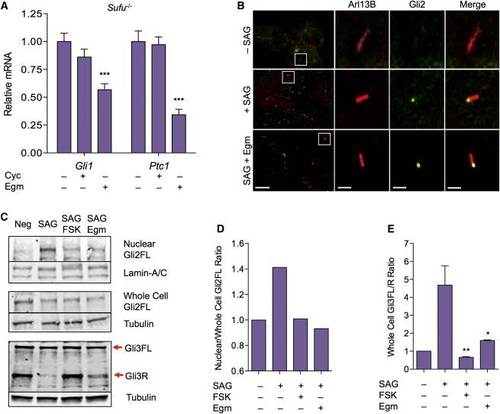
Eggmanone Alters the Activity of Gli Transcription Factors (A) Quantitation of mRNA transcripts of Gli1 and Ptc1 in Sufu-/- cells when treated with 10 µM Cyc (mean ± SEM, n = 7; not significant) or 10 µM Egm (mean ± SEM, n = 10; p = < 0.0001) is given, expression normalized to GAPDH. (B) Immunostaining for the cilium marker Arl13b (red) and Gli2 (green) of unstimulated MEFs (top), MEFs stimulated with SAG (20 nM) in the presence of DMSO control (middle), or 5 µM Egm (bottom). Co-localization of Gli2 (yellow) in the primary cilium remained unchanged in Egm-treated MEFs. Representative cilium (white box) is magnified to the right; scale bar (left column), 10 µm, (columns 2–4) 0.2 µm. (C) Representative western blot for full-length Gli2 in nuclear (top, n = 4) and whole-cell (middle, n = 2) fractions of NIH 3T3 cells, and western blot of Gli3 (bottom, n = 3) from whole-cell lysate of C3H10T1/2 cells. Corresponding western blots for nuclear Lamin-A/C and whole-cell α-tubulin as loading controls are shown. Neg, unstimulated; SAG, stimulated with SAG (100 nM) for 1.5 hr (Gli2) or 24 hr (Gli3); SAG + FSK, co-treated with SAG and FSK (30 µM); SAG + Egm, co-treated with SAG and Egm (10 µM); FL, full-length active forms of Gli2 and Gli3; R, repressor form of Gli3. (D) Quantitative analysis of the mean ratio of normalized nuclear full-length Gli2 to normalized whole-cell Gli2 from (C) is given. (E) Quantitative analysis of the ratio of full-length to repressor form of Gli3 from (C) is given (mean ± SEM, n = 3 for each condition; p = 0.0095, p = 0.028 versus SAG). Related to Figure S2. |