
FIGURE
Fig. 3
- ID
- ZDB-FIG-150511-27
- Publication
- Harty et al., 2015 - Defining the gene repertoire and spatiotemporal expression profiles of adhesion G protein-coupled receptors in zebrafish
- Other Figures
- All Figure Page
- Back to All Figure Page
Fig. 3
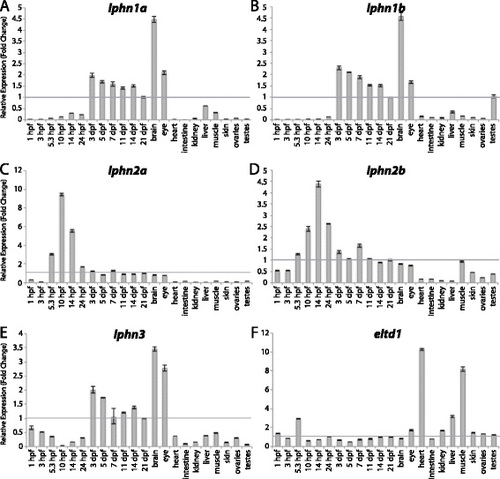
Group I aGPCR expression data. (A-F) Relative expression of zebrafish Group I aGPCRs obtained with high-throughput quantitative real-time PCR from a collection of 12 developmental time-points and 10 adult tissues. (A) lphn1a, (B) lphn1b, (C) lphn2a, (D) lphn2b, (E) lphn3, (F) eltd1. Error bars display the upper (RQmax) and lower (RQmin) limits of possible relative quantification values. Fold changes shown are relative to expression at 21 dpf (denoted by gray line at y = 1). |
Expression Data
| Genes: | |
|---|---|
| Fish: | |
| Anatomical Terms: | |
| Stage Range: | 4-cell to Adult |
Expression Detail
Antibody Labeling
Phenotype Data
Phenotype Detail
Acknowledgments
This image is the copyrighted work of the attributed author or publisher, and
ZFIN has permission only to display this image to its users.
Additional permissions should be obtained from the applicable author or publisher of the image.
Full text @ BMC Genomics