
Fig. 7
- ID
- ZDB-FIG-150413-23
- Publication
- Gu et al., 2015 - Defective apical extrusion signaling contributes to aggressive tumor hallmarks
- Other Figures
- All Figure Page
- Back to All Figure Page
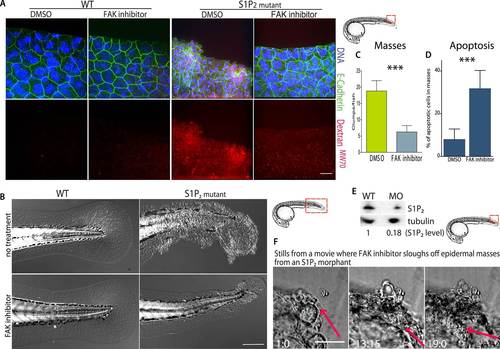
(A) Representative confocal projections of 5-dpf WT (left) and Mil (S1P2 mutant) (right) zebrafish larvae treated with DMSO or FAK inhibitor PF573228, where high Texas-Red Dextran indicates poor permeability in Mil but is greatly reduced when barrier function is improved with FAK inhibitor treatment. Scale bar = 10 µm and red box indicates region of fish imaged. (B) 5 dpf Mil and wild type zebrafish treated with and without FAK inhibitor. Note that while FAK inhibitor-treated Mil have other developmental defects (heart and circulation), there are no obvious clumps as seen in the untreated fish. Scale bar = 100 µm and red box indicates region of fish imaged. Note FAK inhibitor does not affect WT zebrafish. (C) Quantification of epidermal masses in 5 dpf Mil zebrafish larvae with and without PF573228. (D) Quantification of apoptotic cells within epidermal masses with and without PF573228. For both, error bars are SD and p values are ***<0.0001. (E) Immunoblot showing knockdown of S1P2 by photo-activatable morpholinos. (F) Stills from a video where PF573228 was added to S1P2 morphant at 5 dpf, where red arrows show the edge of the epidermis over time, scale bar = 50 µm and red box indicates region of fish imaged. Time is hours:minutes following FAK inhibitor addition. Note: epidermal cells that are sloughed off become embedded in the agarose where fish is mounted. |
| Fish: | |
|---|---|
| Condition: | |
| Knockdown Reagent: | |
| Observed In: | |
| Stage: | Day 5 |