
Fig. 7
- ID
- ZDB-FIG-150407-12
- Publication
- Levitas-Djerbi et al., 2015 - The Hypothalamic Leptin-Neurotensin-Hypocretin Neuronal Networks in Zebrafish
- Other Figures
- All Figure Page
- Back to All Figure Page
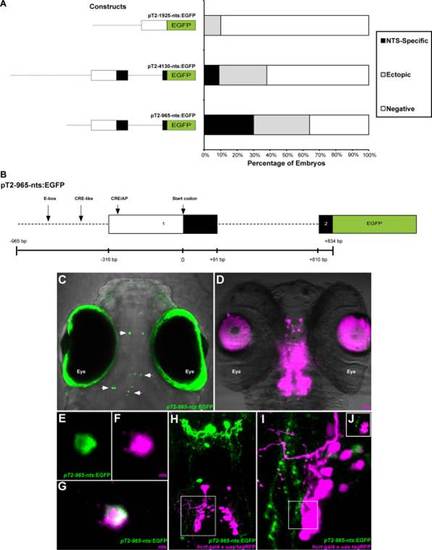
Isolation of a functional nts promoter and live imaging of NTS axon projections. A: Bar graph representing percentages of specific and nonspecific fluorescent expression in 6 dpf larvae injected with pT2–1925-nts:EGFP, pT2–4130-nts:EGFP, or pT2–965-nts:EGFP. B: A schematic illustration of the pT2–965-nts:EGFP construct containing the nts promoter region that includes: 649 bp genomic 52 flanking region, 316 bp 52 UTR, the first exon and intron of the nts gene and 24 bp of the second exon, cloned upstream to EGFP and into a pT2 plasmid. C: At 6 dpf, larvae injected with the pT2–965-nts:EGF P construct displayed mosaic transient expression in NTS neurons. White arrows indicate representative fluorescent cell bodies. D: nts mRNA expression pattern in a 6 dpf larvae. Autofluorescence is shown in the eyes and lens in C,D, respectively. E–G: Colocalization of nts and EGFP in a pT2–965-nts:EGFP injected 6 dpf larvae. H–J: Confocal imaging of 7 dpf hcrt:gal4/uas:tagRFP fish injected with the pT2–965-nts:EGFP construct. NTS-expressing neurons (green) project dorsocaudally in parallel tracts, with branching in the PM and lateral branching extending to HCRT-expressing neurons (magenta) in the Hv. White frame in H is presented at higher magnification in I, and a single plane view of an HCRT cell (magenta) and NTS fiber (green) is shown in J. Hv, ventral zone of the periventricular hypothalamus. |