
Fig. 7
- ID
- ZDB-FIG-150326-57
- Publication
- Saito et al., 2014 - Telomere distribution pattern and synapsis initiation during spermatogenesis in zebrafish
- Other Figures
- All Figure Page
- Back to All Figure Page
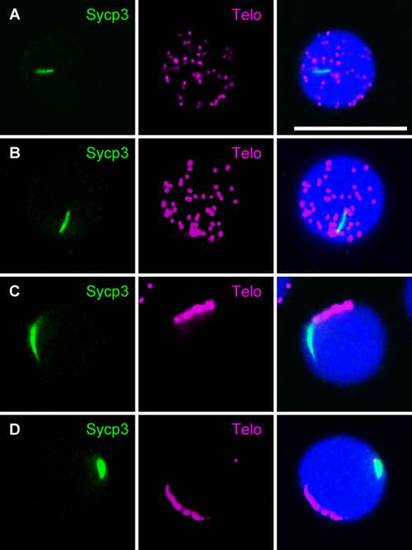
Analysis of the distribution of telomeres by performing FISH using a telomere probe in combination with immunocytochemical labeling of Sycp3 in spermatocytes of the its zebrafish mutant. A: Nucleus of a preleptotene spermatocyte from a wild-type zebrafish exhibits one intranuclear Sycp3 aggregate. B: Telomeres are dispersed throughout the nucleus of a preleptotene spermatocyte from an its mutant zebrafish, similar to the wild-type preleptotene spermatocyte (A). C,D: Another spermatocyte from an its mutant zebrafish exhibits aggregated Sycp3 and is most likely at a preleptotene-equivalent stage, while telomeres are restricted to a small region of the nuclear periphery. In panel C, telomeres are close to Sycp3, whereas in panel D, they are not. Left panels show Sycp3 staining (green), middle panels show FISH signals (magenta), and right panels show merged images of the left and middle panels. Nuclei were stained with TO-PRO-3 (blue). Scale bar = 10 µm. These images are representative of 20 nuclei analyzed at each stage per specimen (n = 3). |
| Gene: | |
|---|---|
| Antibody: | |
| Fish: | |
| Anatomical Term: | |
| Stage: | Adult |