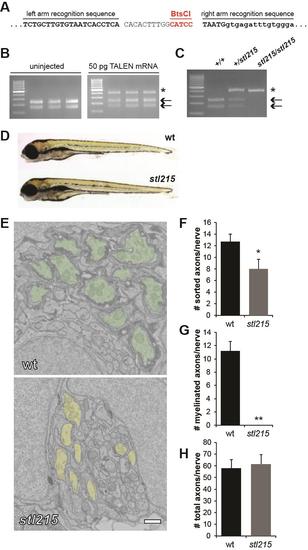
Agonistic peptide deletion ablates Gpr126 function in vivo, Related to Figure 4 (A) Left and right TALEN recognition sequences in gpr126. The unique restriction enzyme site targeted by the TALEN and used for restriction fragment length analysis is underlined in red. Uppercase letters indicate coding sequence, while lowercase letters represent the intronic region. (B) Restriction fragment length analysis of three representative uninjected control embryos and three embryos injected with TALEN mRNA (25 pg left arm, 25 pg right arm) at 24 hpf. The arrows mark wild-type fragments cleaved by BtsCI, while the asterisk marks the undigested product resulting from TALEN-mediated disruption of the restriction enzyme site. (C) Representative image of the stl215 genotyping assay using restriction fragment length analysis. The wt PCR product has an intact BtsCI site and the digest results in two fragments of 239 bp and 158 bp (arrows). The disrupted BtsCI site in stl215 results in an undigested PCR product (asterisk). (D) Lateral view of the morphology of a gpr126stl215/+ (wt) sibling and a gpr126stl215/stl215 mutant at 5 dpf. (E) Transmission electron microscopy (TEM) of cross-sections through the PLLn. To control for developmental variability along the anterior-posterior axis, all nerves were analyzed at approximately the same body segment (between segments 5-7) of 5 dpf zebrafish larvae. wt PLLn (top) have many myelinated axons (green), whereas Schwann cells in gpr126stl215 sort axons (yellow) but fail to spiral their membranes to form myelin. Scale bar = 500 nm. (F-H) Quantification of TEM images from PLLn of wt (gpr126+/+ and gpr126stl215/+) and gpr126stl215 5dpf larvae. For all, n=6 PLLn from N=4 wt larvae, and n=6 PLLn from N=4 mutant larvae. Error bars indicate standard deviation, significance determined via Student’s t-test. (F) Average number of sorted axons per PLLn in wt (12.7±1.4) and mutant (8±1.7) larvae. *p<0.001. (G) Average number of myelinated axons per PLLn in wt (11.1±1.5) and mutant (0±0) larvae. **p<10-8. (H) Average number of total axons per PLLn in wt (57.8±7.7) and mutant (61.5±8.1) larvae. No significant difference was observed (p>0.4).
|
