
Fig. 4
- ID
- ZDB-FIG-150303-1
- Publication
- Nakayama et al., 2014 - Identification and expression analysis of zebrafish polypeptide α-N-acetylgalactosaminyltransferase Y-subfamily genes during embryonic development
- Other Figures
- All Figure Page
- Back to All Figure Page
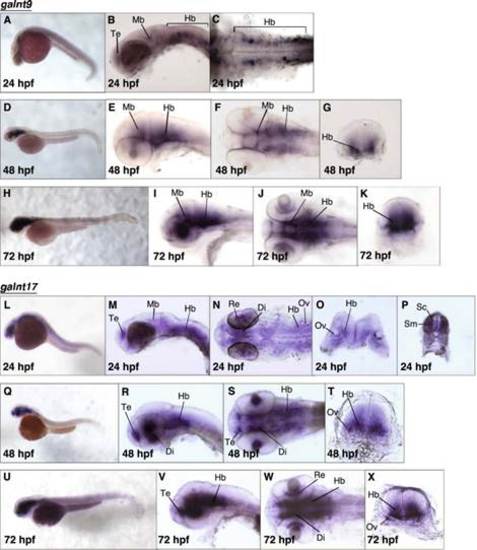
Spatial expression patterns of galnt9 and galnt17 during developmental stages. Whole mount in situ hybridization of galnt9 (A–K) and galnt17 (L–X) was performed at the developmental stages indicated at the bottom left corners. Lateral views with anterior to the left and dorsal to the top (A, B, D, E, H, I, L, M, Q, R, U, and V). Dorsal views with anterior to the left (C, F, J, N, S, and W). Transverse section views of the middle hindbrain (G, K, O, T, and X) and of the trunk musculature (P). Te; telencephalon, Mb; midbrain, Hb; hindbrain, Re; retina, Di; diencephalon, Ov; otic vesicle, Sc; spinal cord, Sm; somitic musculature. |
| Genes: | |
|---|---|
| Fish: | |
| Anatomical Terms: | |
| Stage Range: | Prim-5 to Protruding-mouth |
Reprinted from Gene expression patterns : GEP, 16(1), Nakayama, Y., Nakamura, N., Kawai, T., Kaneda, E., Takahashi, Y., Miyake, A., Itoh, N., Kurosaka, A., Identification and expression analysis of zebrafish polypeptide α-N-acetylgalactosaminyltransferase Y-subfamily genes during embryonic development, 1-7, Copyright (2014) with permission from Elsevier. Full text @ Gene Expr. Patterns