
Fig. 7
- ID
- ZDB-FIG-150211-24
- Publication
- Paulus et al., 2014 - Loss of Optineurin In Vivo Results in Elevated Cell Death and Alters Axonal Trafficking Dynamics
- Other Figures
- All Figure Page
- Back to All Figure Page
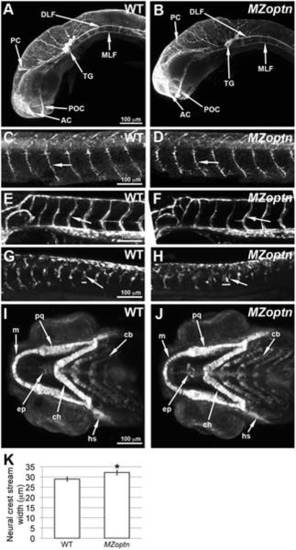
MZoptn embryos have defects in the migration of neural crest cells. A–J. Compressed z-stacks of WT (A, C, E, G, I) or MZoptn (B, D, F, H, J) embryos. Embryos are mounted laterally (A–H) or ventrally (I, J) with anterior to the left. A, B. α-acetylated alpha-tubulin staining of axon tracts in 25 hpf embryos. The MZoptn embryos have normal axon pathfinding (arrows). C, D. α-SV2 staining of spinal motor axons in 2 dpf embryos. These axons are guided normally in MZoptn embryos (arrows). E, F. GFP labeled endothelial cells in 2 dpf embryos show that intersegmental vessels are patterned correctly in MZoptn embryos (arrows). G, H. GFP labeling of neural crest cells in 23 hpf embryos. The ventrally directed streams of cells (arrows) in the trunk are in the right location, but the width of the streams is wider in MZoptn embryos along the anterior-posterior axis (horizontal bars correspond to width of above stream). I, J. GFP labeling of neural crest cells that are contributing to the jaw cartilage in 4 dpf embryos. The elements of the jaw cartilage in MZoptn embryos appear normal (arrows), including Meckel’s cartilage (m), palatoquadrate (pq), ceratohyal (ch), hyosympathetic (hs), ethmoid plate (ep) and ceratobranchials (cb). K. Quantification of the width of the neural crest streams in G, H. * indicates p≤0.05. |
| Fish: | |
|---|---|
| Observed In: | |
| Stage Range: | 26+ somites to Long-pec |