
Fig. 3
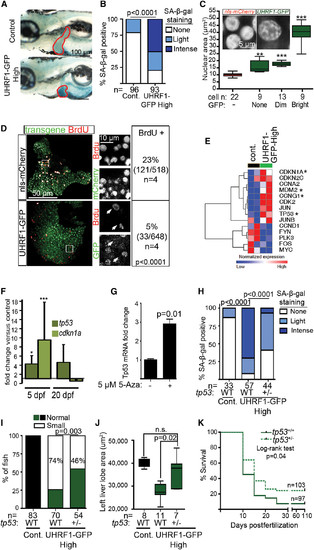
UHRF1 Overexpression in Hepatocytes Induces Tp53-Mediated Senescence (A) Intense senescence-associated β-galactosidase (SA-b-gal) staining was detected in the liver (outlined) of 5 dpf UHRF1-GFP High larvae compared to light or no staining in controls. (B) Five dpf fish from five clutches were scored for hepatic SA-b-gal staining. ***p < 0.0001 by Fisher’s exact test. (C) Nuclear size was measured in hepatocytes of a single control or UHRF1-GFP High 5 dpf liver, and cells were stratified according to GFP expression. Inset shows confocal stack of the DNA organized into foci. **p < 0.001 and ***p < 0.0001, compared to nuclear size in nls-mCherry larvae. (D) BrdU-positive cells and the total number of transgene-expressing hepatocytes in nls-mCherry and UHRF1-GFP High larvae (bottom) 5 dpf larvae. A Fisher’s exact test was used to calculate p value. In nls-mCherry larvae, most BrdU-positive cells also express the transgene, whereas the BrdUpositive cells in UHRF1-GFP High livers did not express GFP (white arrows in magnified regions, which are marked by the white box). (E) Heatmap of log2 values from RNA-seq shows cell-cycle regulators are down and Tp53 target genes (marked by *) are up in UHRF1-GFP High 5 dpf livers. (F) tp53 and cdkn1a mRNA expression were induced on 5 dpf and downregulated on 20 dpf in UHRF1-GFP High livers. *p = 0.05; ***p = 0.001 calculated by one sample Student’s t test. Error bars represent SD. (G) 5-Aza induces Tp53 expression in primary mouse hepatocytes. Student’s t test was used to determine p value with SD indicated by the error bars across three replicates. (H–K) tp53+/- in UHRF1-GFP High larvae significantly reduced SA-b-gal staining in the liver (two clutches) (H), and increased the percent of larvae with normal liver size (I), the area of the left liver lobe (J), and survival at 5 dpf (K). p values were calculated with a Fisher’s test with Freeman- Halton extension (H), Fisher’s exact test (I), and Student’s t test. Boxes represent 75th and 25th percentile, horizontal line is the median, and whiskers mark lowest and highest values (J). |
| Genes: | |
|---|---|
| Fish: | |
| Anatomical Terms: | |
| Stage: | Day 5 |
| Fish: | |
|---|---|
| Observed In: | |
| Stage: | Day 5 |
Reprinted from Cancer Cell, 25(2), Mudbhary, R., Hoshida, Y., Chernyavskaya, Y., Jacob, V., Villanueva, A., Fiel, M.I., Chen, X., Kojima, K., Thung, S., Bronson, R.T., Lachenmayer, A., Revill, K., Alsinet, C., Sachidanandam, R., Desai, A., SenBanerjee, S., Ukomadu, C., Llovet, J.M., and Sadler, K.C., UHRF1 overexpression drives DNA hypomethylation and hepatocellular carcinoma, 196-209, Copyright (2014) with permission from Elsevier. Full text @ Cancer Cell