
FIGURE
Fig. S1
- ID
- ZDB-FIG-140324-45
- Publication
- Weber et al., 2013 - Characterization of light lesion paradigms and optical coherence tomography as tools to study adult retina regeneration in zebrafish
- Other Figures
- All Figure Page
- Back to All Figure Page
Fig. S1
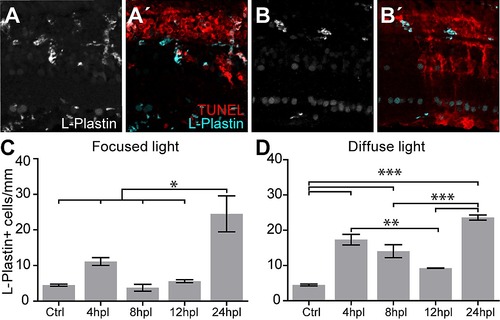
L-Plastin+ cells are enriched in light lesions at 24 hpl. A: L-Plastin+ cells were found in various retinal cell layers after focused light lesions. A2: Double labeling with TUNEL (red) shows only minimum overlap and mostly complementary location of L-Plastin+ cells (cyan). B, B2: Diffuse light lesion analogous to A, A2. C, D: Time course of absolute number of L-Plastin+ cells found in focused (C) and diffuse light lesion (D) showing a peak at 24 hpl. Error bars indicate standard error of the mean; *** for p-values <0.001; ** for p-values <0.01; * for p<0.05. |
Expression Data
Expression Detail
Antibody Labeling
Phenotype Data
Phenotype Detail
Acknowledgments
This image is the copyrighted work of the attributed author or publisher, and
ZFIN has permission only to display this image to its users.
Additional permissions should be obtained from the applicable author or publisher of the image.
Full text @ PLoS One