
Fig. 8
- ID
- ZDB-FIG-140305-35
- Publication
- Blader et al., 1997 - The activity of Neurogenin1 is controlled by local cues in the zebrafish embryo
- Other Figures
- All Figure Page
- Back to All Figure Page
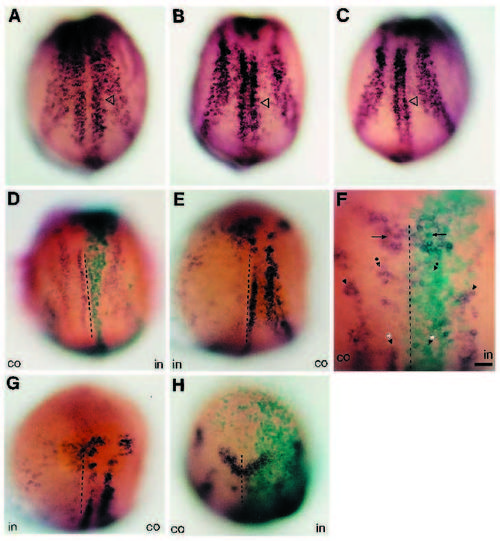
Expression of ngn1 is modulated by Shh. (A-C) ngn1 expression in 3-somite stage embryo injected in both blastomeres at the 2-cell stage with dnReg (A), shh RNA (B) and an uninjected control (C). The medial rows of ngn1 expression in the neural plate appear broadened in dnReg- and shh-injected embryos (open arrowhead). (D-G) Embryos at the 3-somite stage injected with a constitutively active PKA (PKA*) and β-gal RNA; only one blastomere of the 2- cell stage embryo was injected. Embryos were stained for ngn1 expression (purple) and β-gal enzymatic activity (turquoise). Control and injected sides are indicated by co and in, respectively. Arrowheads in F indicate dorsal neuron precursors (alone), motor neuron precursors (with asterisks) and a bilateral pair of hindbrain nuclei (with dots); arrows in F mark the midbrain/hindbrain boundary. The midline of the neural plate is indicated by a dotted line. (H) Embryo injected with β-gal RNA alone. Dorsal views; anterior up. |