
Fig. 3
- ID
- ZDB-FIG-140204-47
- Publication
- Westhoff et al., 2013 - Development of an Automated Imaging Pipeline for the Analysis of the Zebrafish Larval Kidney
- Other Figures
- All Figure Page
- Back to All Figure Page
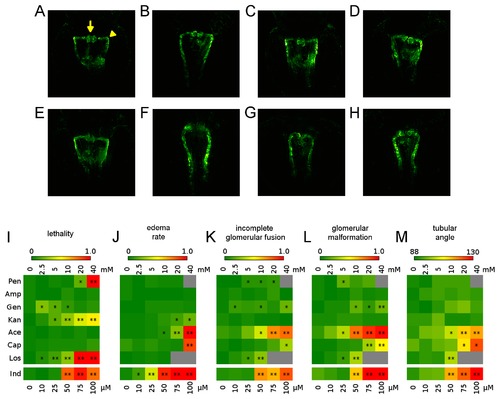
Overview of compound concentration-dependent pronephric phenotypes. Illustrative examples of pronephroi of a (A) non-treated embryo, and after treatment with (B) 20 mM penicillin, (C) 40 mM ampicillin, (D) 40 mM gentamicin, (E) 40 mM kanamycin, (F) 40 mM acetaminophen, (G) 40 mM captopril, (H) 10 mM losartan. For examples of phenotypes after Indomethacin treatment see Figure 4A-E. Arrow and arrowheads in (A) indicate the different morphological parameters of the pronephros scored to evaluate compound effect on the developing kidney. Arrow: fused glomeruli; Arrowhead: angle between the neck segment and the proximal convoluted tubule. (I-M) Heatmaps showing (I) lethality rates, (J) edema rates and (K-M) changes in morphological parameters of the pronephros. In detail, (K) incomplete glomerular fusion, (L) glomerular malformation and (M) tubular angle. For further details see Materials and Methods and Tables S1-S3. Colour codes indicate the percentage of embryos (I-L) with particular phenotype, or the angle between neck segment and proximal convoluted tubule (M) as indicated by the colour coded legend. Grey squares indicate missing data points. Concentration ranges used are indicated above the heatmaps, or below for Indomethacin, respectively. Abbreviations: penicillin (Pen), ampicillin (Amp), gentamicin (Gen), kanamycin (Kan), acetaminophen (Ace), captopril (Cap), losartan (Los) and indomethacin (Ind). *p<0.05, **p<0.001. |