
FIGURE
Fig. 4
- ID
- ZDB-FIG-140122-35
- Publication
- Jamison et al., 2013 - In Vivo Wall Shear Measurements within the Developing Zebrafish Heart
- Other Figures
- All Figure Page
- Back to All Figure Page
Fig. 4
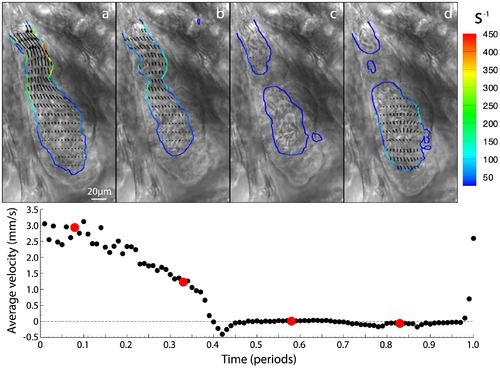
Brightfield images of four equally spaced time points within the cardiac cycle with contours of wall shear (s 1) and vectors of velocity overlaid (Movie S1 provides all 100 times points in the cardiac cycle). For clarity only every second vector is shown in the horizontal direction and every fifth in the vertical direction. Average velocity through the ventricular-bulbar valve is shown below the brightfield images, with red circles indicating the time points corresponding to points (a) – (d). |
Expression Data
Expression Detail
Antibody Labeling
Phenotype Data
Phenotype Detail
Acknowledgments
This image is the copyrighted work of the attributed author or publisher, and
ZFIN has permission only to display this image to its users.
Additional permissions should be obtained from the applicable author or publisher of the image.
Full text @ PLoS One