
Fig. 6
- ID
- ZDB-FIG-140103-5
- Publication
- Yang et al., 2013 - Expression of unc5 family genes in zebrafish brain during embryonic development
- Other Figures
- All Figure Page
- Back to All Figure Page
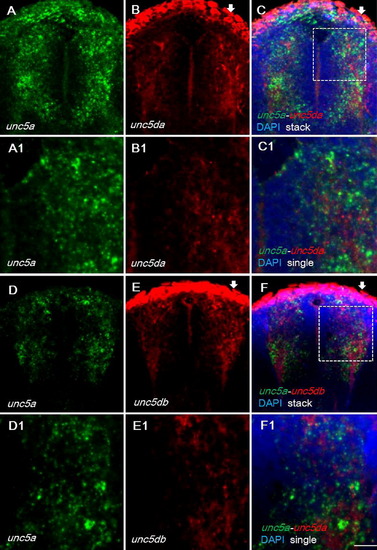
Expression pattern of unc5a-unc5da and unc5a-unc5db in zebrafish forebrain examined by fluorescent in situ hybridization (FISH). The probes used for in situ hybridization are listed in the lower left corner of each panel. The embryos are in the frontal view, dorsal to the top. The embryo was counterstained with DAPI to show the cell nuclei (C, C1, F, F1). The dorsal telencephalon regions in C and F are marked with a white square, and enlarged views are shown in A1–C1 and D1–F1. Projections of the image stacks are shown in A-C and D–F; images of single confocal planes are shown in A1–C1 and D1–F1. The white arrows in B, C, E, and F indicate the unspecific staining for epidermis. Scale bar (under F): A–C, D–F, 40 μm; A1–C1, D1–F1, 16 μm. |
| Genes: | |
|---|---|
| Fish: | |
| Anatomical Term: | |
| Stage: | Long-pec |
Reprinted from Gene expression patterns : GEP, 13(8), Yang, B., Peng, G., and Gao, J., Expression of unc5 family genes in zebrafish brain during embryonic development, 311-8, Copyright (2013) with permission from Elsevier. Full text @ Gene Expr. Patterns