
Fig. 2
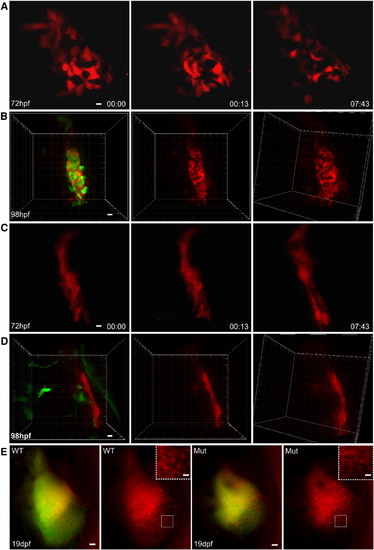
Morphological Transformation of Thymic Epithelial Cells upon Contact with Lymphocyte Progenitors (A) Still photographs of a time-lapse recording of a representative double-transgenic ikaros+/+ embryo (ikaros:eGFP [green fluorescence]; foxn1:mCherry [red fluorescence]). The still series begins at 72 hpf (00 hr:00 min). Only the red channel is shown to demonstrate the rapid changes of cell shape of thymic epithelial cells. Representative results for ten embryos. Scale bar represents 5 μm. (B) Three-dimensional rendering of the thymic anlage in a double-transgenic ikaros+/+ fish to demonstrate the many intimate contacts between lymphocytes and epithelial cells. Representative results for ten embryos. Scale bar represents 5 μm. (C) Still photographs of a time-lapse recording of a representative double-transgenic ikaros-/- embryo (ikaros:eGFP [green fluorescence]; foxn1:mCherry [red fluorescence]). The still series begins at 72 hpf (00 hr:00 min). Only the red channel is shown to demonstrate the undifferentiated nature of thymic epithelial cells in the absence of lymphocyte progenitors in the thymus. Representative results for ten embryos. Scale bar represents 5 μm. (D) Three-dimensional rendering of the thymic anlage in a double-transgenic ikaros-/- fish to demonstrate the blunted appearance of thymic epithelial cells. Representative results for ten embryos. Scale bar represents 5 μm. (E) Onset of morphological transformation of thymic epithelial cells upon contact with lymphocyte precursors. Still photographs of time-lapse recordings of double-transgenic ikaros+/+ (wt) ikaros-/- (mut) embryos. The photographs were taken at 19 dpf. Red and green channels are combined in the first and third panel; the red channel only is shown in the second and fourth panel. The insets highlight the indistinguishable reticular shape of thymic epithelial cells in both embryos after colonization of the thymus. Representative results for three wild-type and three mutant embryos. Scale bar represents 5 μm. See also Figure S1. |
| Genes: | |
|---|---|
| Fish: | |
| Anatomical Terms: | |
| Stage Range: | Protruding-mouth to Days 14-20 |
| Fish: | |
|---|---|
| Observed In: | |
| Stage Range: | Day 4 to Days 14-20 |
Reprinted from Immunity, 36(2), Hess, I., and Boehm, T., Intravital Imaging of Thymopoiesis Reveals Dynamic Lympho-Epithelial Interactions, 298-309, Copyright (2012) with permission from Elsevier. Full text @ Immunity