
Fig. 3
- ID
- ZDB-FIG-130807-5
- Publication
- Fang et al., 2013 - Characterization of transgenic zebrafish lines that express GFP in the retina, pineal gland, olfactory bulb, hatching gland, and optic tectum
- Other Figures
- All Figure Page
- Back to All Figure Page
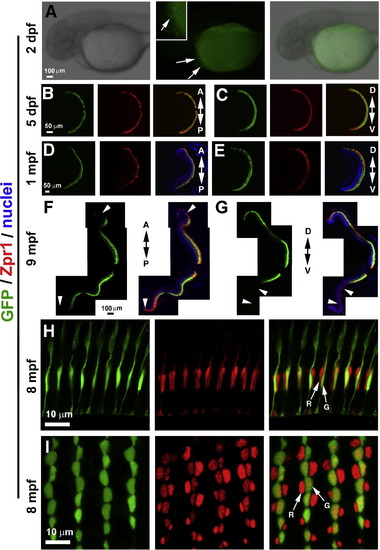
The Tg(LCRRH2-RH2-2:GFP)pt115-k line expresses GFP in the green cones and hatching gland. (A) Stereo-fluorescent microscopy shows weak GFP signals in the hatching gland at 2 dpf (arrows). The inset shows a magnified image of the GFP-positive hatching gland cells. The green fluorescent signals in the yolk were non-specific auto-fluorescence. (B–E) GFP expression is present in the entire photoreceptor layer in the retina at 5 dpf and 1 mpf. A-P and D-V arrows are for anterior-posterior and dorsal–ventral direction, respectively. (F and G) At 9 mpf, the GFP expression is absent in anterior and posterior peripheral retinal regions as well as a significantly large ventral retinal area. (H and I) Vertical (H) and transverse (I) imaging of photoreceptors show GFP (green) is specifically expressed in green cones (arrow G), but not in red cones (arrow R) or other types of photoreceptors (8 mpf). The green/red double cones were visualized with zpr1 antibodies. The cell nuclei were labeled with DAPI. |
Reprinted from Gene expression patterns : GEP, 13(5-6), Fang, W., Bonaffini, S., Zou, J., Wang, X., Zhang, C., Tsujimura, T., Kawamura, S., and Wei, X., Characterization of transgenic zebrafish lines that express GFP in the retina, pineal gland, olfactory bulb, hatching gland, and optic tectum, 150-9, Copyright (2013) with permission from Elsevier. Full text @ Gene Expr. Patterns