
Fig. 2
- ID
- ZDB-FIG-130610-9
- Publication
- Xie et al., 2012 - Silencer-delimited transgenesis: NRSE/RE1 sequences promote neural-specific transgene expression in a NRSF/REST-dependent manner
- Other Figures
- All Figure Page
- Back to All Figure Page
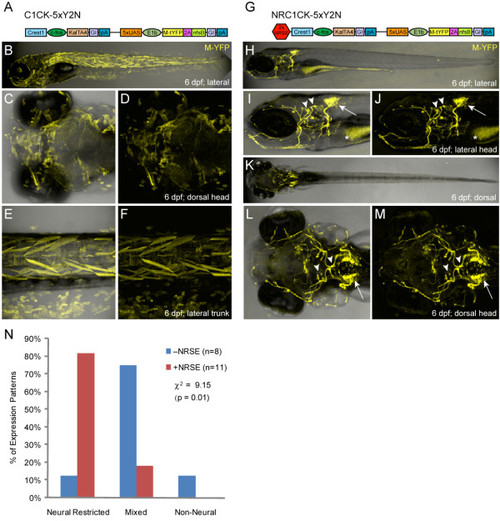
CREST1-cfos transgene comparisons ±NRSE. Plasmid diagrams and representative confocal images of lines derived with the CREST1-cfos enhancer-minimal promoter element ±NRSE, one C1CK-5xY2N (A-F) and one NRC1CK-5xY2N (G-M) line is shown (6 dpf). (A) C1CK-5xY2N plasmid diagram. (B-F) The majority of C1CK-5xY2N lines showed mixed expression patterns (B), with labeling of epidermis, skeletal muscle and notochord often evident (C-F). (G) NRC1CK-5xY2N plasmid diagram. (H-M) The majority of NRC1CK-5xY2N lines had expression restricted to a cranial motor neuron subpopulation (H) - the expression pattern originally characterized as CREST1-specified [35] - including cranial nerve X neurons in the hindbrain (arrows, I, J and L, M) and cranial nerve VII and V neurons in the midbrain (arrowheads, I, J and L, M). Autofluorescence in the gut is marked by asterisks (I, J). (N) Quantification of phenotypes from non-NRSE (-NRSE, blue bars, total of eight lines) and NRSE-containing (+NRSE, red bars, total of 11 lines) CREST1-cfos lines; expression patterns were classified as either neural-restricted (as in H-M), mixed (as in B-F), or non-neural (example not shown). The data shows a clear trend toward neuronally restricted expression patterns when NRSE elements are included in CREST1-cfos transgenes. A chi-square test of independence showed significant differences between the ±NRSE phenotyping datasets (values shown in graph). |