
FIGURE
Fig. s1
Fig. s1
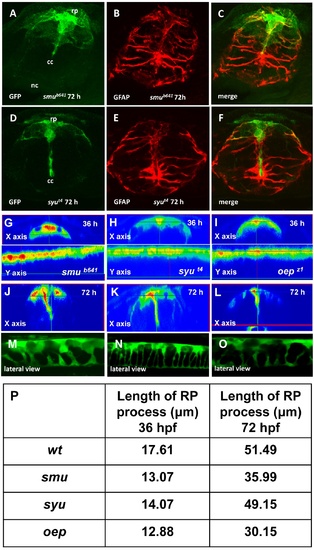
Mutant analysis of RP formation. Immunofluorescent staining of the transverse sections of the spinal cord of smu (A-C) and syu (D-F) mutants. Confocal images of the spinal cord of smu (M), syu (N) and oep (O) mutants at 72 hpf. Orthogonal optical sections of the confocal images of the spinal cord of smu (G, J), syu (H, K) and oep (I, L) mutants at different developmental stages. (P), The length of RP process in different mutants. |
Expression Data
Expression Detail
Antibody Labeling
Phenotype Data
| Fish: | |
|---|---|
| Observed In: | |
| Stage Range: | Prim-25 to Protruding-mouth |
Phenotype Detail
Acknowledgments
This image is the copyrighted work of the attributed author or publisher, and
ZFIN has permission only to display this image to its users.
Additional permissions should be obtained from the applicable author or publisher of the image.
Full text @ PLoS One