
Fig. 1
- ID
- ZDB-FIG-130322-20
- Publication
- Lawton et al., 2013 - Regulated tissue fluidity steers zebrafish body elongation
- Other Figures
- All Figure Page
- Back to All Figure Page
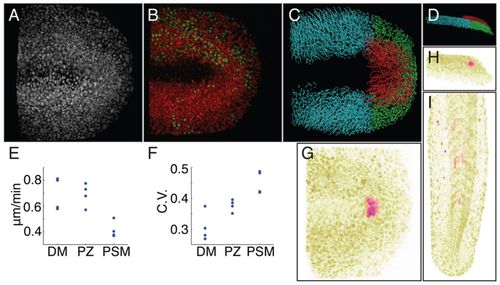
Cell movement in the wild-type zebrafish tailbud. (A) Confocal image stacks of RFP-labeled nuclei were taken through time and nuclei were tracked in 4D. (B) Independent tracking of red and green double-labeled nuclei revealed cell tracking to be 85% accurate. (C) Cell tracks were divided into regions of interest: dorsal medial zone (DM; red), progenitor zone, (PZ; green), presomitic mesoderm (PSM; cyan). (D) A lateral view of the image shown in C. (E) Examination of mean track speeds. P-values calculated using ANOVA with additional validation by permutation tests. The DM and PZ speeds are equivalent (DM vs PZ, P>0.05) and are higher than PSM (DM vs PSM, P<0.05; PZ vs PSM, P<0.05). (F) The means of the coefficient of variation (CV) of track speed show that the CV increases from the DM to PZ (P<0.05) and from the PZ to PSM (P<0.05). (G-I) Two-photon labeling of DM cells at the ten-somite stage. (G) Dorsal view. (H) Lateral view. (I) After completing elongation, the uncaged cells differentiated as myofibers. A-C and G are dorsal views. In all panels, anterior is left the right except panel I in which anterior is up. |