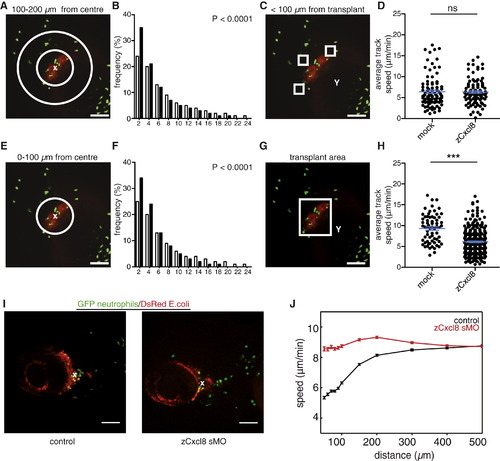
zCxcl8 Locally Restricts Neutrophil Motility(A and E) SDCM example image of neutrophils (green) within the area of transplanted mCherry/zCxcl8 cotransfected cells (red). Areas between circles indicate zones at different distances from transplant center (indicated with a white x) that were used for the motility analysis shown in (B) and (F).(B and F) Distribution of instantaneous speed of individual neutrophil steps in the presence (black bars; n = 16,138 for B; n = 13,646 for F) or absence (white bars; n = 9,486 for B; n = 3,234 for F) of zCxcl8 (two-tailed chi-square test). Data were binned every 2 μm/min.(C and G) SDCM example images of neutrophils (green) within the area of transplanted mCherry/zCxcl8 cotransfected cells (red). Representative cubes indicate example areas at different distances from transplant, such that were used for motility analysis shown in (D) and (H), respectively.(D and H) Average track speed in the presence or absence (mock) of zCxcl8. For (D), mock: n = 92, zCxcl8: n = 97; for (H), mock: n = 66, zCxcl8: n = 290 tracks (Mann-Whitney test). Y, yolk sac. ns, not significant; p < 0.0001.(I) Representative images of larvae infected with E. coli and treated or not with zCxcl8 sMO. x, center of infection.(J) Evolution of neutrophil speed with the distance from the center of the infection site.For (D), (H), and (J) error bars indicate SEM. For (B), (F), (D), (H), and (J), data are pooled from three to four larvae per case in three or four experiments. For (A), (C), (E), (G), and (I), scale bars represent 100 μm. See also Figure S3 and Movies S2 and S3.
|
