
Fig. 8
- ID
- ZDB-FIG-130129-33
- Publication
- Goldsmith et al., 2013 - Zebrafish glafenine-intestinal injury is ameliorated by mu-opioid signaling via enhancement of Atf6-dependent cellular stress responses
- Other Figures
- All Figure Page
- Back to All Figure Page
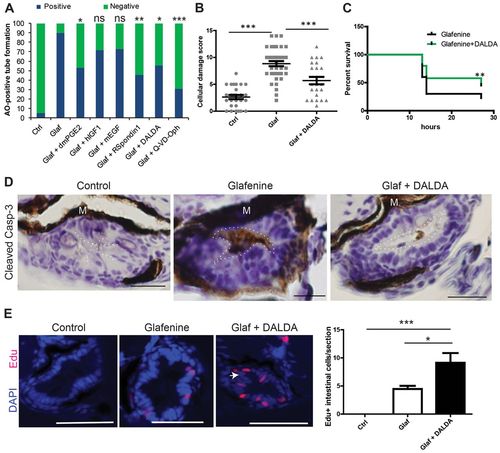
Glafenine-induced injury can be prevented with a subset of anti-apoptotic and/or pro-survival drugs, including the MOR agonist DALDA. (A-E) All studies performed after 12 hours of drug(s) exposure. (A) Rapid apoptosis assays show that glafenine-induced injury can be prevented by drugs that engage pro-survival and/or anti-apoptotic signaling, but not solely proliferative signalling; n≥15 per group. Control, glafenine and glafenine + DALDA results are all representative of three or more independent experiments; dmPGE2 results are representative of two independent experiments; other drugs results are representative of replicate experiments performed on the same day with different groups of larvae. Significance shown is relative to glafenine treatment alone; P<0.001 between control and glafenine groups (not shown on graph); n for each group is represented on the graph. Dosages: 10 μM dmPGE2, 250 ng/ml hIGF1, 10 nM mEGF and R-spondin, 50 μM Q-VD-Oph. (B) Segment 2 histological scores. Control and glafenine groups are recapitulated from Fig. 1, for ease of comparison with DALDA treatment. (C) DALDA enhances zebrafish survival from glafenine-induced injury. n=50, pooled from three independent experiments. Glafenine was used at 50 μM final concentration. (D) Activated caspase-3 immunohistochemistry staining in the intestinal epithelium. Representative of four fish per group. The lumenal edge is outlined in white; M, melanocytes. Scale bars: 12.5 μm. (E) Proliferation in segment 2 in response to drug treatment. White arrow shows hyperplastic cells seen with DALDA administration. Scale bars: 50 μm. Graph shows EdU staining of zebrafish with 12 hours of drug exposure for each group. n≥8, except for control group, where n=4; *P<0.05, **P<0.01, ***P<0.001. |