
Fig. 4
- ID
- ZDB-FIG-121204-29
- Publication
- Manuel González-Rosa et al., 2012 - Pan-epicardial lineage tracing reveals that epicardium derived cells give rise to myofibroblasts and perivascular cells during zebrafish heart regeneration
- Other Figures
- All Figure Page
- Back to All Figure Page
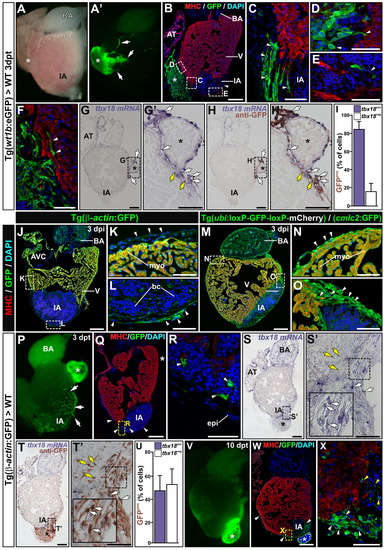
Transplantation assays allow the study of pan-EPDC migration and differentiation during cardiac regeneration. (A,A′) Brightfield and fluorescence images of a freshly-dissected 3 dpt wildtype heart transplanted with a Tg(wt1b:eGFP) graft. Arrows mark GFP+ extensions of the graft migrating over the host. (B) Whole heart cross-section showing the Tg(wt1b:eGFP) graft adhered to the host. (C-F) Zoomed views of boxed areas in B (C-E) or areas from adjacent sections (F), showing the epicardial sheet covering the IA (C), protrusions of wt1b:eGFP+ cells extending towards the host myocardium (D), a migratory wt1b:eGFP+ cell inside the IA (E), and GFP+ cells intermingled with host cardiomyocytes (F). Arrowheads mark GFP+ cells. (G,G′) Whole-mount and zoomed views of an in situ hybridization with a tbx18 riboprobe on a section of a transplanted heart at 3 dpt. (H,H′) Section in G after immunohistochemistry with anti-GFP. (I) Percentage of GFP+/tbx18+ and GFP+/tbx18- cells in the host. Data are means of cell percentages ±S.D. counted on 2-3 heart sections per specimen from 5 specimens (80 cells counted per section). (J-O) Immunohistochemistry on sections of Tg(-actin:GFP) (J-L) and Tg(ubi:loxP-GFP-loxP-mCherry)/(cmlc2:GFP) hearts (M-O). Antibodies/stains used are indicated to the left of the panels. Arrowheads mark epicardial cells. (P-X) Tg(-actin:GFP)>WT transplants at 3 and 10 dpt. Arrowheads mark graft-derived cells. (P) Whole-mount fluorescence view at 3 dpt. Arrows point to grafted cells on the surface of the host heart. (Q) Immnohistochemistry on a sagittal section of the heart shown in P. (R) Zoomed view of boxed area in Q revealing cells that migrated into the IA. (S,S′) Whole-mount and zoomed views of in situ hybridization with tbx18 on a Tg(β-actin:GFP)>WT heart section. (T,T′) Section as in S and S′ after immunostaining for GFP. Note the strong overlap of tbx18 and GFP expression. (U) Percentage of GFP+/tbx18+ and GFP+/tbx18- cells in the host. Data are means of cell percentages ±S.D. counted on 3 heart sections per specimen from 3 specimens (50 cells counted per section). (V) Full view of a freshly dissected heart at 10 dpt. (W) Immunohistochemistry on a sagittal section of the heart shown in V. Antibodies used are specified in the panel. (X) Zoomed view of boxed area in V, revealing cells forming an epicardial cap over the IA. Note that no GFP+/MHC+ cells are detected. In all panels, asterisks mark the graft or its position in a consecutive section. In G-H′ and S-T′ white arrows label GFP+/tbx18+ cells and yellow arrows GFP+/tbx18- cells. AVC, atrioventricular canal, epi, epicardium. Other abbreviations are as in previous figures. Bars, 200 μm (full views) and 50 μm (magnifications). |
Reprinted from Developmental Biology, 370(2), Manuel González-Rosa, J., Peralta, M., and Mercader, N., Pan-epicardial lineage tracing reveals that epicardium derived cells give rise to myofibroblasts and perivascular cells during zebrafish heart regeneration, 173-186, Copyright (2012) with permission from Elsevier. Full text @ Dev. Biol.