
Fig. 3
- ID
- ZDB-FIG-121119-4
- Publication
- Rodriguez-Mari et al., 2011 - Roles of brca2 (fancd1) in Oocyte Nuclear Architecture, Gametogenesis, Gonad Tumors, and Genome Stability in Zebrafish
- Other Figures
- All Figure Page
- Back to All Figure Page
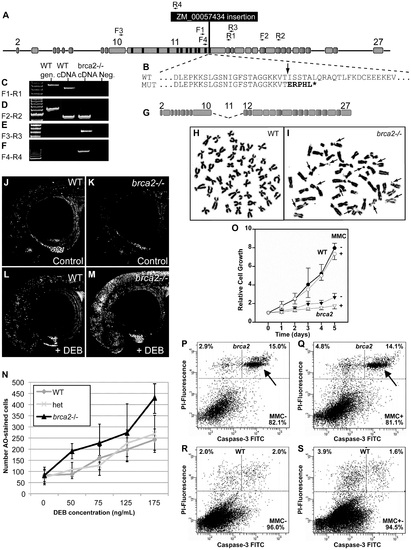
A zebrafish brca2 insertional mutant reveals a role for brca2 in zebrafish genome stability and cell growth. (A) The ZM_00057434 insertion disrupts exon-11 of zebrafish brca2 in the last BRC repeat. (B) The insertion (arrow) disrupts the wild-type (WT) sequence, leading to a mutant (MUT) sequence that contains five substituted amino acid residues encoded by the insert followed by a stop codon (*) that truncates the protein before the DNA binding domain, which is essential for Brca2 activity. (C) Amplification using primers F1 and R1 (see panel A and Table S1) produced a transcript from wild-type cDNA but none from homozygous mutant cDNA. (D) Amplification using primers F2 and R2 showed that transcripts including exon-18 occur in both wild types and mutants. (E) Amplification using primers F3 and R3 revealed that mutants, but not wild types, made transcripts that lack exon-11. (F) Amplification using primers F4 and R4 showed that mutants, but not wild types, made transcripts that include part of exon-11 and the insert. (G) The transcript amplified in panel F is predicted to make a transcript that lacks exon-11 but continues in-frame and makes a non-functional protein lacking all BRC repeats. (H) Most tissue culture cells established from the caudal fin of wild-type adults had a normal karyotype even after MMC treatment. (I) Most tissue culture cells established from the caudal fin of homozygous brca2 mutant adults showed chromatid breaks after MMC treatments, including acentric fragments, and radial chromosomes (arrows). (J,K) Acridine orange (AO) treatment of wild types and brca2 mutants not treated with DEB revealed about equal levels of cells staining with AO. (L,M) After DEB treatment, the number of AO-positive cells increased a small amount in 28hpf wild-type embryos but increased substantially in 28hpf brca2 mutant embryos. (N) The number of AO-positive cells increased with DEB concentration in all three genotypes tested, but nearly twice as much in brca2 mutant cells. (O-S) Growth, apoptosis and non-apoptotic cell death in cultured zebrafish fibroblasts. (O) Cell cultures established from brca2 mutant caudal fins (brca2, triangles) grew slower than cultures established from wild types (circles), reaching only 33.5% of the control count after 5 days. The additional effect of 15 nM mitomycin C (MMC) on growth retardation was relatively low but more distinct in brca2 mutant cultures than wild-type cultures (open triangles and open circles, respectively). The graph displays the mean and standard deviation of multiples of the seeded cell number from three independent experiments. (P-S) Apoptosis is mainly responsible for the growth deficit of brca2 mutant cells. (P) Untreated brca2 cultures showed spontaneous apoptosis of 15% of cells (upper right quadrant) and 2.9% of cells experienced non-apoptotic death (upper left quadrant). (Q) Exposure to 50 nM mitomycin C for 24 h increased the non-apoptotic cell death rate in brca2 mutant cultures only to 4.8%, whereas the rate of apoptotic cells remained about the same (14.1%). (R) Wild-type cultures revealed just 2% spontaneous apoptosis (upper right quadrant) and 2% non-apoptotic cell death (upper left quadrant). (S) Exposure to 50 nM mitomycin C for 24 h increased the non-apoptotic cell death rate to 3.9% but left the rate of apoptotic cells unchanged (1.6%). |