
Fig. 2
- ID
- ZDB-FIG-121023-27
- Publication
- Semova et al., 2012 - Microbiota regulate intestinal absorption and metabolism of Fatty acids in the zebrafish
- Other Figures
- All Figure Page
- Back to All Figure Page
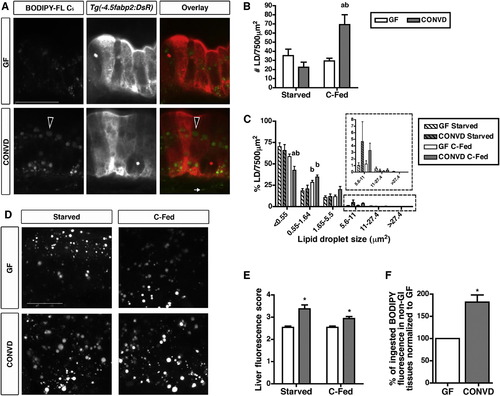
The Microbiota Stimulate Lipid Absorption into Intestinal Epithelial Lipid Droplets and Extraintestinal Tissues (A) Representative confocal images of fixed 6 dpf Tg(4.5fabp2:DsRed) GF and CONVD zebrafish fed a control diet and incubated with BODIPY-FL C5 for 6 hr. Scale bar, 20 μm. DsRed-expressing intestinal epithelial cells show BODIPY-C5 accumulation as lipid droplets (LDs) in the epithelium and the lamina propria (white arrow). Large LDs are detected in the epithelium of CONVD zebrafish (black arrowheads).(B and C) Lipid droplet quantification assay was developed using Volocity software (see Figures S1A–S1F) to determine LD number (B) and size frequency (C) in an epithelial region of interest (7,500 μm2). The graphs depict the mean ± SEM of at least two independent experiments (3–15 fish/condition/experiment). Results of statistical significance analysis: a, significant versus GF fed same diet; b, significant versus starved in same microbial condition. See Figure S2 for data from a 3 hr time point. (D) Representative confocal images of livers in 6 dpf GF and CONVD zebrafish incubated with BODIPY-FL C5 for 6 hr. Scale bar, 20 μm. (E) BODIPY-C5 fluorescence scores of livers of 6 dpf GF and CONVD zebrafish. The graph depicts the mean ± SD of two independent experiments (3–5 fish/condition/experiment) that were scored blindly (score scale 0–5). (F) Non-GI BODIPY-C5 fluorescence in GF and CONVD C-fed zebrafish. The data represent mean ± SD of two experiments (20–30 carcasses and 9–10 whole larvae/condition/experiment). Significant differences are indicated: *p < 0.05 (E and F). |