
Fig. 4
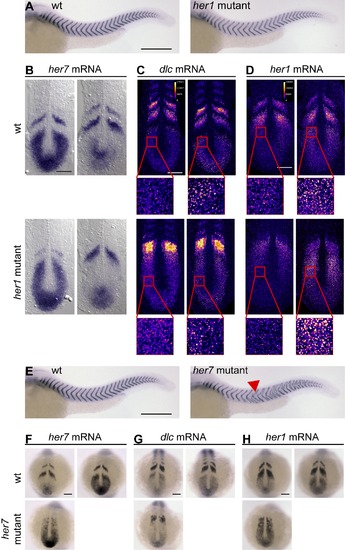
Genetic mutants indicate that her7 and her1 have distinct functions. (A) Wildtype (wt, left) and her1 mutant (right) embryos at 34 hours post fertilization (hpf) stained for cb1045 expression to visualize segmentation. Anterior segmentation defects in her1 mutant embryos were of variable severity, and a representative embryo is shown. See Figure S4D for a quantitative analysis of segmentation defects in her1 mutants. (B–D) wt (upper row) and her1 mutant (lower row) embryos at the 10-somite stage in situ stained for her7 (B), dlc (C), or her1 (D) mRNA expression. her1 and dlc expression patterns (C and D) were visualized using tyramide chemistry and displayed in FIRE lookup table to distinguish onset of expression waves (high intensity punctate signal in insets) from later phases of the oscillation cycle (punctae with lower intensity or diffuse signal). (E) wt (left) and her7 mutant (right) embryos at 34 hpf stained for cb1045 expression to visualize segmentation. Red arrowhead points to anterior-most segmentation defects in her7 mutants. (F–H) wt (upper row) and her7 mutant (lower row) embryos at the 10-somite stage in situ stained for her7 (F), dlc (G), or her1 (H) mRNA expression. (A) and (E–H) are whole mount preparations, and (B–D) are flat mount preparations. (B–D) and (F–H) Two representative examples per condition are shown to illustrate oscillatory expression, except for her7 mutants (F–H). Scale bar: 300 μm for (A and E), and 100 µm for all other panels. |