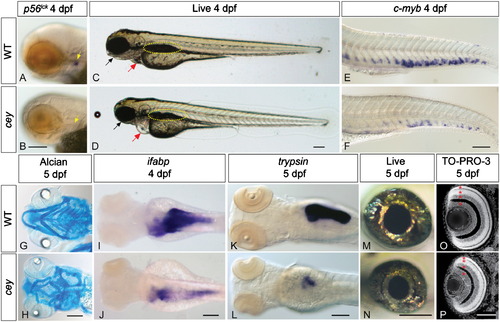
Many tissue types are severely reduced inceymutants. All figures are oriented anterior to the left. p56lck labels T cells in 4 dpf zebrafish larvae (A, yellow arrow). Cey mutants have severely reduced p56lck expression at 4 dpf (B, yellow arrow) suggesting a lack of T cells. In comparison to live wild-type larvae at 4 dpf (C), live cey mutants (D) have small eyes, heart edema (red arrow), and a deformed jaw (black arrow). Yellow dotted line designates the swim bladder (C, D). Although the tail is morphologically normal, there is a severe reduction of HSPCs in cey mutants at 4 dpf as shown by the severe reduction of c-myb positive cells in cey mutants (F) as compared to wild-type (E). Alcian blue staining indicates the mandibular and hyoid arches are smaller and malformed in cey mutants at 5 dpf (H) as compared to wild-type (G). Endodermal derivatives are severely reduced in cey mutants (I–L). Intestinal tissue labeled with ifabp is severely reduced in cey mutants at 4 dpf (I, J). In addition, exocrine pancreas labeled by trypsin is severely reduced in mutants at 5 dpf (K, L). The eyes of cey mutants are smaller than wild-type eyes at 5 dpf (M, N). Despite the smaller eye size, all cell layers are present in cey mutant retinas (O, P). Red asterisks label each retinal layer (O, P). Scale bars are 130 μm (A–L) and 95 μm (M–P). (For interpretation of the references to color in this figure legend, the reader is referred to the web version of this article.)
|
