Fig. 6
|
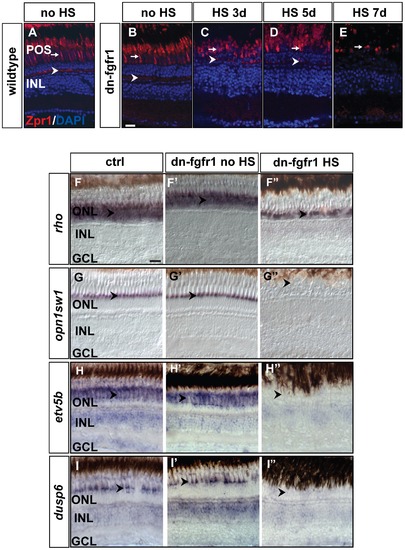
Loss of photoreceptor marker gene expression after Fgf-receptor inhibition. A) Expression of the double cone marker Zpr1 in the outer segments (arrow) and in the photoreceptor synaptic terminals (arrowhead) of control siblings after 7 days of HS. B) Expression or Zpr1 in transgenic fish without HS (arrow and arrowhead), C) after 3 days of HS (arrow and arrowhead), D) after 5 days of HS (arrow and arrowhead), and E) after seven days of HS. Hardly any photoreceptor marker expression remains visible in outer segments (arrow) and the photoreceptor synaptic terminals are no longer detectable. F) The rod photoreceptor marker rhodopsin (rho) is expressed in the ONL (arrowhead) of control siblings. F2) rho expression in the ONL in transgenic non-heatshocked control fish (arrowhead). F3) Reduced rho expression (arrowhead) in dn-fgfr1 transgenic fish after 5 days of HS. G) WT expression of UV opsin (opn1sw1) as a cone photoreceptor marker (arrowhead). G2) Similar expression of UV opsin in the POS of untreated transgenics (arrowhead). G3) Expression of UV opsin is completely absent in transgenic experimental fish (arrowhead) after 2 days of HS. H) WT expression of the Fgf signaling downstream target gene etv5b. Prominent expression is seen in the POS (arrowhead). H2) Comparable expression in untreated dn-fgfr1 fish (arrowhead). H3) Complete lack of etv5b expression after 2 days of heat shock of dn-fgfr1 fish (arrowhead). I) The downstream target dusp6 is expressed broadly in the retina and prominently in the POS (arrowhead). I2) In untreated transgenic fish, a similar pattern as in control siblings was detected with distinct expression in the POS (arrowhead). I3) After 2 days of heat shock induction of the dn-fgfr1 transgene, dusp6 expression is completely lost in the neural retina, including the POS (arrowhead). Scale bars = 20 μm. |

