
Fig. 6
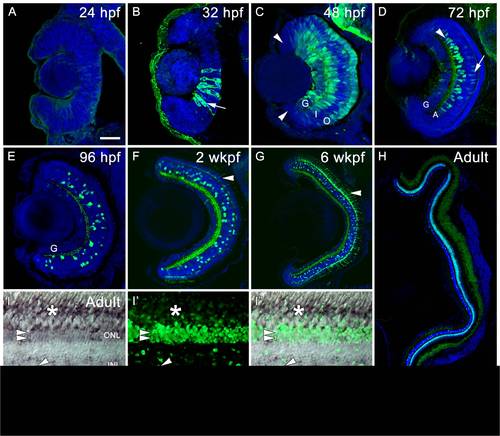
Retinal sections from embryonic Tg(nrd:egfp)/albino zebrafish showing EGFP in green and a nuclear stain, TO-PRO-3, in blue (A–H). All retinas are oriented with dorsal toward the top and ventral toward the bottom. RNA in situ hybridization in adult Tg(nrd:egfp)/albino retinas comparing endogenous expression of neurod to the transgene (I–I′′). (A) At 24 hpf, EGFP is not detected in the retinal neuroepithelium. (B) At 32 hpf, EGFP is detected in a few cells immediately adjacent to the ventral nasal patch (arrow). (C) At 48 hpf, distinct retinal layers can be visualized. EGFP is detected in the ganglion cell layer (G), inner nuclear layer (I) at the level of the amacrine cells, and in the outer nuclear layer (O), but from this timepoint onward, is not detected in the CMZ (arrowheads). (D) At 72 hpf, EGFP expression is restricted to very few ganglion cells (G), a subset of amacrine (A) and bipolar cells (arrow), as well as the inner plexiform layer (arrowhead). (E) At 96 hpf, persistent EGFP expression is visible in a subset of amacrine and bipolar cells, in the inner plexiform layer, and very weakly expressed in a few ganglion cells (G). (F) At 2 wkpf, EGFP begins to reappear in a subset of rod photoreceptors (arrowhead). (G) At 6 wkpf, a majority of rod photoreceptors express EGFP as well as a subset of amacrine and bipolar cells, and the inner plexiform layer. (H) In the adult eye, all rod photoreceptors express EGFP, as well as a subset of amacrine and bipolar cells. (I–I′ ′′) Comparing endogenous neurod (I) to transgenic neurod (I′′) in the adult retina. Endogenous neurod is weakly expressed in rod photoreceptor soma in the outer nuclear layer (ONL, double arrowheads) and their corresponding rod inner segments (asterisk). Expression is also observed in individual neurons in the inner nuclear layer (INL). Strong EGFP was observed in the ONL (double arrowheads) and rod inner segments (above), and in individual neurons in the INL. Every EGFP-positive cell contains at least some endogenous neurod, but the levels vary greatly. Some cells have strong EGFP expression but weak endogenous neurod (single arrowhead), while other show the opposite expression profile (arrow). Scale bars: 50 microns (A–G), 300 microns (H), 50 microns (I–I′ ′′). |