
Fig. 1
- ID
- ZDB-FIG-111128-71
- Publication
- Muto et al., 2011 - Multifactorial Origins of Heart and Gut Defects in nipbl-Deficient Zebrafish, a Model of Cornelia de Lange Syndrome
- Other Figures
- All Figure Page
- Back to All Figure Page
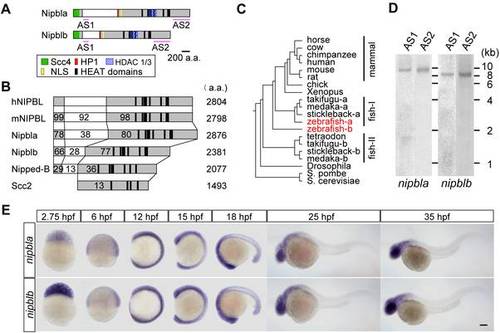
Zebrafish nipbl genes. (A) Domain structure of Nipbla and Nipblb proteins. N- and C-terminal conserved regions are shown in gray; predicted domains and motifs as colored boxes. Pink lines indicate positions used for antisense RNA probes. (B) Comparison of Nipbl orthologs among species. Numbers indicate amino acid identity to human NIPBL, as determined by Clustal W analysis (http://clustalw.ddbj.nig.ac.jp/top-j.htm l). (C) Phylogenic tree of Nipbl proteins, constructed by the NJ method (http://www.ddbj.nig.ac.jp/), using full-length amino acid sequences from the Ensembl database. (D) Expression of nipbla and nipblb mRNAs at 9 hpf was analyzed by Northern blotting (10 µg total RNA per lane) using DIG-labeled antisense RNA probes. Two different probes for each gene (see panel A) were used. (E) Expression patterns analyzed by ISH with nipbla (upper) and nipblb (lower) AS1 probes at indicated stages. Views are lateral, with anterior to the top (2.75–15 hpf) and left (18–35 hpf). Scale bar: 100 μm. |
| Genes: | |
|---|---|
| Fish: | |
| Anatomical Terms: | |
| Stage Range: | 512-cell to Prim-15 |