
Fig. 4
- ID
- ZDB-FIG-110929-46
- Publication
- Jayasena et al., 2011 - Live imaging of endogenous Collapsin response mediator protein-1 expression at subcellular resolution during zebrafish nervous system development
- Other Figures
- All Figure Page
- Back to All Figure Page
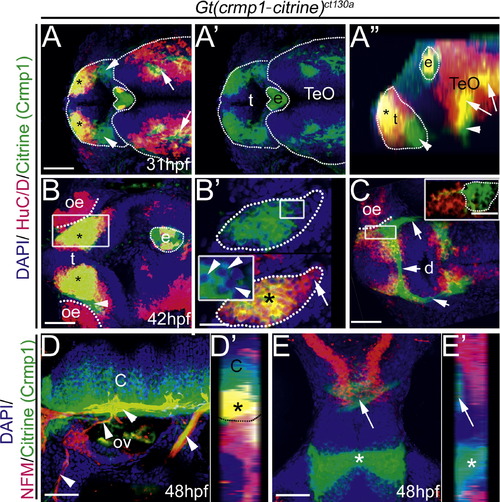
Crmp1 expression (green) compared to neuronal markers HuC/D (A–C) and NFM (D–E) (red). Gt(crmp1-citrine)ct130a heterozygotes were stained with anti-green fluorescent protein to enhance the citrine signal and the nuclear stain (DAPI; blue) to visualize nuclei. (A)–(B) Dorsal view z-stack projection at the level of telencephalon (t) and optic tectum (TeO) at 31 hpf (A) and 42 hpf (B). Asterisk: co-expression of HuC/D and Crmp1. e; epiphysis. (A) Arrowheads: Neurons positive for Crmp1 in the telencephalon. Arrows: Crmp1 and HuC/D positive cells in the optic tectum (TeO). (A2) Crmp1 expression alone. (A3) Lateral reconstructed projection of the z-stack from (A). Arrowhead: Crmp1 expression devoid of HuC/D expression. Arrows: Crmp1 and HuC/D positive cells. Asterisk: HuC/D and Crmp1 positive cells in the telencephalon. (B)–(C) oe, olfactory epithelium. (B2) Magnified z-section from boxed region in (B) showing that majority of HuC/D cells are also positive for Crmp1 (highlighted dotted region; asterisk). Arrow: HuC/D positive and Crmp1 negative cells. Inset in (B2) shows that Crmp1 is localized to the cytoplasm (arrowheads) and excluded from the nucleus. (C) Ventral view z-stack projection of the diencephalon (d) at 42 hpf. Arrows: cell projections positive for Crmp1. Inset: magnified view of boxed region. Highlighted Crmp1 cells are negative for HuC/D. (D) Lateral view z-projection at the level of the otic vesicle (ov) and cerebellum (c). Arrowheads: axon projections that are NFM and Crmp1 positive. (E) Crmp1 cells at the level for the forebrain (asterisk) and optic tectum (arrow) are negative for NFM. (D2), (E2) Ninty-degree rotated z-stack reconstructed projection of (D) and (E) respectively. (D2) Dotted outline delineates cerebellum (C) from the peripheral tissue. Asterisk: NFM and Crmp1 positive axon tracks. Scale: 50 μM (A)–(B), (C)–(D), 25 μM ((B2) and inset (C)). |
| Gene: | |
|---|---|
| Antibodies: | |
| Fish: | |
| Anatomical Terms: | |
| Stage Range: | Prim-15 to Long-pec |
Reprinted from Gene expression patterns : GEP, 11(7), Jayasena, C.S., and Bronner-Fraser, M., Live imaging of endogenous Collapsin response mediator protein-1 expression at subcellular resolution during zebrafish nervous system development, 395-400, Copyright (2011) with permission from Elsevier. Full text @ Gene Expr. Patterns