
Fig. 3
- ID
- ZDB-FIG-110406-4
- Publication
- Goode et al., 2011 - Minor change, major difference: divergent functions of highly conserved cis-regulatory elements subsequent to whole genome duplication events
- Other Figures
- All Figure Page
- Back to All Figure Page
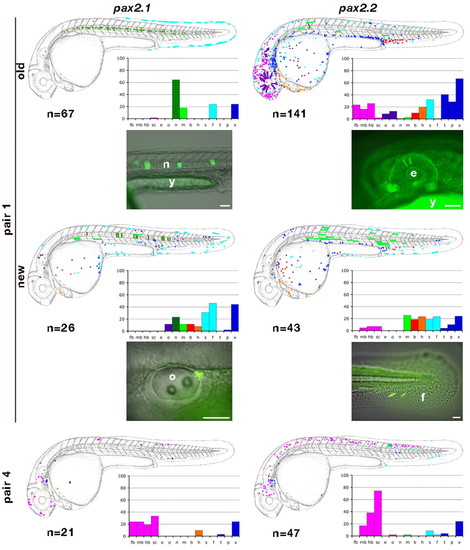
Schematic diagrams of expression profiles derived from assaying pax2 element pairs 1 and 4. Expression in each domain is colour coded according to the key in Fig. 2 and mapped onto camera lucida drawings of day 2 and day 3 zebrafish embryos (day 2 is shown here). Results are overlaid from multiple embryos. n indicates the number of embryos analyzed. The percentage of GFP-positive embryos with expression in each domain (y-axis) is indicated in the respective bar charts. For pair 1, ‘old’ indicates results from our original assay and ‘new’ indicates results from our newer assay without the flanking sequences. Live images of day 3 embryos are also shown for these assays, with expression in the notochord (pax2.1 old), eye (pax2.2 old), otic vesicle (pax2.1 new) and fin (pax2.2 new). Expression in the eye is shown as a fluorescent image, whereas the rest are shown as merged fluorescent and bright-field images. b, blood; e, eye; f, fin; fb, forebrain; h, heart; hb, hindbrain; m, muscle; mb, midbrain; n, notochord; o, otic vesicle; p, pronephric region; s, skin; sc, spinal cord; t, thyroid region; x, other, unclassified; y, yolk. Scale bars: 50 μm. |