
Fig. 2
- ID
- ZDB-FIG-101207-42
- Publication
- Gamba et al., 2010 - Lef1 controls patterning and proliferation in the posterior lateral line system of zebrafish
- Other Figures
- All Figure Page
- Back to All Figure Page
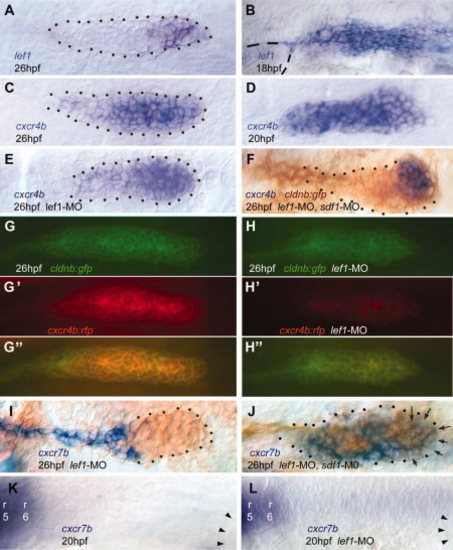
Expression of lef1, cxcr4b, and cxcr7b. A,B: Expression of lef1 at 26 and 18 hours postfertilization (hpf), respectively. Dashes outline the otic vesicle. C,D: Expression of cxcr4b at 26 and 20 hpf, respectively. E,F: Expression of cxcr4b at 26 hpf in lef1-MO and in double lef1-MO, sdf1-MO embryos. G,G": expression of gfp (green) and of rfp (red) in cxcr4b:rfp, cldnb:gfp embryos. G": Merge. H,H": Same as G,G", but in lef1-MO embryos. The intensity of the red and green in panels G and H is linearly proportional to the intensity of fluorescence (see material and methods). I,J: expression of cxcr7b at 26 hpf in lef1-MO and in double lef1-MO, sdf1-MO embryos. Arrows indicate cells expressing cxcr7b in the leading region of the primordium. K,L: Expression of cxcr7b at 20 hpf in control and in lef1-MO embryos. The presumptive placode extends from rhombomere r6, labeled by out-of-focus cxcr7 expression (Cubedo et al.,2009), and the anterior edge of the first somite, indicated by arrowheads. In A, C, E, F, I, J, dots delineate the primordium. In B, D, K and L, the presumptive primordium is not readily detected under Nomarski optics, and therefore was not outlined. MO, morpholino oligonucleotide. Scale bars = 50 μm. |