
Fig. 2
- ID
- ZDB-FIG-101207-35
- Publication
- März et al., 2010 - Expression of the transcription factor Olig2 in proliferating cells in the adult zebrafish telencephalon
- Other Figures
- All Figure Page
- Back to All Figure Page
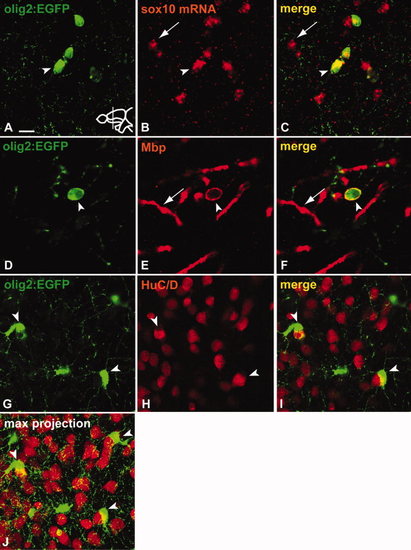
Parenchymal olig2-expressing cells belong to the oligodendrocyte lineage. A–C: Co-staining of GFP (A) with fluorescent in situ hybridization against sox10 (B). Tg(olig2:EGFP)-positive cells in the parenchyma co-express sox10 (arrowhead) (C). Arrow indicates cell expressing sox10 only. D–F: Co-staining of GFP (D) with Mbp antibody (E). Arrowhead indicates co-expression of GFP and Mbp (F), arrow indicates Mbp-positive myelin sheath. G–J:Tg(olig2:EGFP)-positive cells (G) do not express HuC/D (H) but often can be found tightly associated with HuC/D-positive neurons (arrowheads in G–J). J is a confocal Z-stack maximum projection to illustrate the tight association of Tg(olig2:EGFP)-positive cells with neighbouring neurons. Scale bars = (A–C) 10 μm, (D–F) 5 μm, (G–J) 10 μm. |