
Fig. 3
- ID
- ZDB-FIG-101123-15
- Publication
- Murphy et al., 2010 - Disruption of angiogenesis and tumor growth with an orally active drug that stabilizes the inactive state of PDGFR{beta}/B-RAF
- Other Figures
- All Figure Page
- Back to All Figure Page
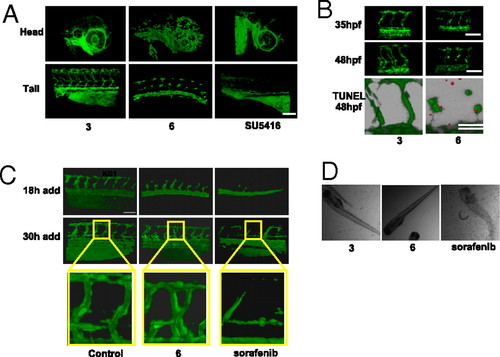
Compound 6 inhibits angiogenesis in the zebrafish. (A) Effect of 6 on angiogenesis in transgenic fli1-egfp zebrafish embryos. Embryos were treated with 1 μM 6 or SU5416, or 10 μM 3 from 20 until 48 hpf. Representative 3D reconstructions of the blood vasculature are shown for both the head and tail regions of the embryo. Designations for the major vessels in the head and tail of the zebrafish embryo at 48 hpf are available in Fig. S3A. (B) Disruption of lumen formation in the zebrafish during late vessel maturation. Zebrafish treated with either 1 μM 6 or 10 μM 3 from 20 to 48 hpf were imaged at 35 and 48 hpf. (Bottom) 6 induces apoptosis in the intersegmental vessels in the zebrafish. Shown is a 3D overlap reconstruction of the GFP-expressing intersegmental vessels with TUNEL-positive nuclei at 48 hpf (shown in red). Representative phase-contrast views as well as quantification of intersegmental vessel volumes from A and B can be found in Fig. S3 B–D, respectively. (C) Time course of drug addition to zebrafish. Compounds (2.5 μM 3 or 6, 1 μM sorafenib, or DMSO as control) were added at either 18 or 30 hpf (left on the embryos for the duration of the experiment), and intersegmental vessels were imaged H24 h after the time point corresponding to drug addition. At 30 hpf, the zebrafish embryos established early vessels with evident lumens. Compound 6 and sorafenib were added to evaluate their effect on preexisting vasculature. (D) Phase-contrast images of zebrafish treated with 3, 6, or sorafenib (same concentrations as in C). The images demonstrate that embryos treated with 3 and 6 are viable whereas sorafenib causes death. n = 4–6 zebrafish embryos per condition for all treatments. (Scale bars, 100 μm.) |
| Gene: | |
|---|---|
| Fish: | |
| Conditions: | |
| Anatomical Term: | |
| Stage: | Long-pec |