
FIGURE
Fig. 6
- ID
- ZDB-FIG-101026-16
- Publication
- Good-Avila et al., 2009 - Relaxin gene family in teleosts: phylogeny, syntenic mapping, selective constraint, and expression analysis
- Other Figures
- All Figure Page
- Back to All Figure Page
Fig. 6
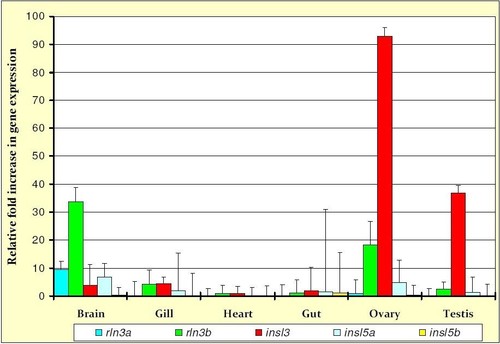
Relative fold increase (with standard deviation) in mRNA expression of five relaxin family genes in six tissues relative to their expression in eye and normalized by the expression of the housekeeping gene, b2m (see text for details). Relative expression of relaxin family genes rln3a, rln3b, insl3, insl5a and insl5b were assessed in the brain, gill, heart, gut, ovary and testis dissected from adult zebrafish. |
Expression Data
| Genes: | |
|---|---|
| Fish: | |
| Anatomical Terms: | |
| Stage: | Adult |
Expression Detail
Antibody Labeling
Phenotype Data
Phenotype Detail
Acknowledgments
This image is the copyrighted work of the attributed author or publisher, and
ZFIN has permission only to display this image to its users.
Additional permissions should be obtained from the applicable author or publisher of the image.
Full text @ BMC Evol. Biol.