
FIGURE
Fig. 4
- ID
- ZDB-FIG-100903-6
- Publication
- Cox et al., 2010 - Zebrafish Wnt9a,9b paralog comparisons suggest ancestral roles for Wnt9 in neural, oral-pharyngeal ectoderm and mesendoderm
- Other Figures
- All Figure Page
- Back to All Figure Page
Fig. 4
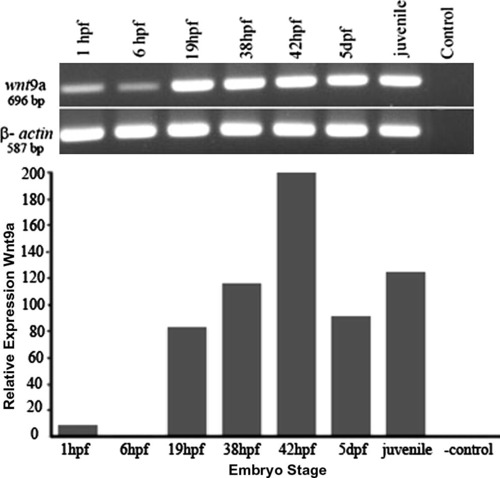
Developmental RT-PCR profile of wnt9a mRNAs. Amplification of β-actin (587 bp) was run in parallel to standardize input cDNA. RT-PCR amplification of a region of the wnt9a ORF (696 bp) reveals increasing expression levels after zygotic gene expression begins at 3 hpf peaking around 2 dpf then leveling off. Expression is maintained in mature zebrafish, indicated by the juvenile (1.5 months). Q-PCR analysis reveals that the highest level of expression is approximately 200x greater than the expression at 6 hpf which is normalized to 1. Negative control is no RT. |
Expression Data
| Gene: | |
|---|---|
| Fish: | |
| Anatomical Term: | |
| Stage Range: | 4-cell to Days 45-89 |
Expression Detail
Antibody Labeling
Phenotype Data
Phenotype Detail
Acknowledgments
This image is the copyrighted work of the attributed author or publisher, and
ZFIN has permission only to display this image to its users.
Additional permissions should be obtained from the applicable author or publisher of the image.
Reprinted from Gene expression patterns : GEP, 10(6), Cox, A.A., Jezewski, P.A., Fang, P.K., and Payne-Ferreira, T.L., Zebrafish Wnt9a,9b paralog comparisons suggest ancestral roles for Wnt9 in neural, oral-pharyngeal ectoderm and mesendoderm, 251-258, Copyright (2010) with permission from Elsevier. Full text @ Gene Expr. Patterns