
Fig. 1
- ID
- ZDB-FIG-100628-58
- Publication
- Verstraeten et al., 2010 - Zebrafish teeth as a model for repetitive epithelial morphogenesis: dynamics of E-cadherin expression
- Other Figures
- All Figure Page
- Back to All Figure Page
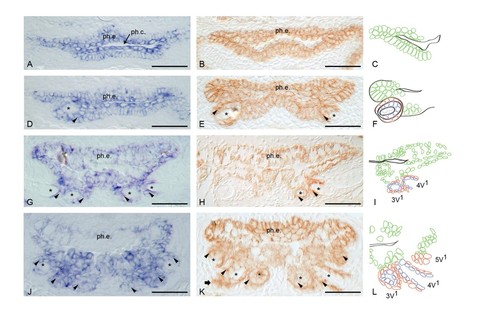
Expression pattern of E-cadherin in first-generation teeth. Left panels: mRNA expression; middle panels: protein expression; right panels: diagram of different cell layers of the tooth. A, B, C: Initiation phase. D, E, F: Morphogenesis phase; G, H, I: Early cytodifferentiation and attachment phase; J, K, L: Late cytodifferentiation phase and initiation of successor. ph.c.: pharyngeal cavity; ph.e.: pharyneal epithelium; *: dental papilla; arrowhead: enamel organ; block arrow: initiation replacement tooth. Diagrams: green cells: pharyngeal epithelium; red cells: outer dental epithelium; blue cells: inner dental epithelium. Scale bars = 2 5 μm. |