
FIGURE
Fig. S2
Fig. S2
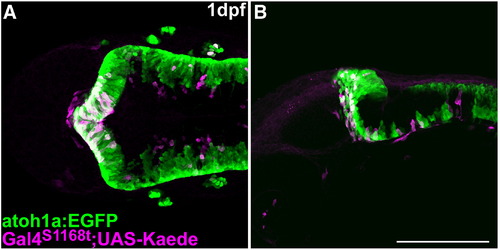
Characterization of Et(fos:Gal4-VP16)s1168t:Tg(UAS-E1b: Kaede)s1999t. Expression of atoh1a:EGFP (green) and Kaede (magenta) in Et(fos:Gal4-VP16)s1168t; Tg(UAS-E1b: Kaede)s1999t; Tg(atoh1a:EGFP) at 1 dpf. Immunostaining with anti-GFP and anti-Kaede antibodies. Dorsal (A) and lateral (B) views with rostral to the left. Kaede was detected in the tectum and the atoh1a:EGFP+ rostral cerebellum. Scale bar: 200 μm. |
Expression Data
Expression Detail
Antibody Labeling
Phenotype Data
Phenotype Detail
Acknowledgments
This image is the copyrighted work of the attributed author or publisher, and
ZFIN has permission only to display this image to its users.
Additional permissions should be obtained from the applicable author or publisher of the image.
Reprinted from Developmental Biology, 343(1-2), Kani, S., Bae, Y.K., Shimizu, T., Tanabe, K., Satou, C., Parsons, M.J., Scott, E., Higashijima, S.I., and Hibi, M., Proneural gene-linked neurogenesis in zebrafish cerebellum, 1-17, Copyright (2010) with permission from Elsevier. Full text @ Dev. Biol.