
Fig. 1
- ID
- ZDB-FIG-100121-11
- Publication
- Pijnappel et al., 2009 - Quantitative mass spectrometry of TATA binding protein-containing complexes and subunit phosphorylations during the cell cycle
- Other Figures
- All Figure Page
- Back to All Figure Page
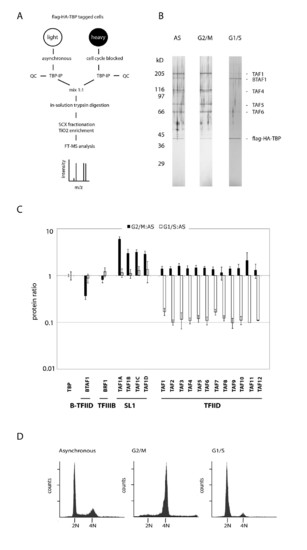
Quantitation of TBP interactors in mitotic and S phase cells. (A) Experimental setup. TBP complexes were isolated from SILAC-labelled cells grown asynchronously or blocked at G2/M or G1/S. QC: ∼2% of the immunoprecipitates were analyzed on NuPage 4-12% Bis-Tris gradient gel followed by silver staining for quality control, as shown in (B). The rest of the immunoprecipitates were digested in solution with trypsin. Tryptic fragments were fractionated by SCX and phosphopeptides were enriched using titanium dioxide. Peptides were identified and quantified by nano-LC-MS. (C) Quantitation of TBP interactors in G2/M blocked or G1/S blocked cells relative to asynchronous cells. Protein levels are normalized for TBP. Data represent means of at least three quantified peptides +/- SD. (D) FACS profiles of asynchronous (left panel), nocadozole-treated (middle panel), and double thymidine-treated (right panel) cells. |