
FIGURE
Fig. 1
- ID
- ZDB-FIG-100114-16
- Publication
- Anelli et al., 2009 - Global repression of cancer gene expression in a zebrafish model of melanoma is linked to epigenetic regulation
- Other Figures
- All Figure Page
- Back to All Figure Page
Fig. 1
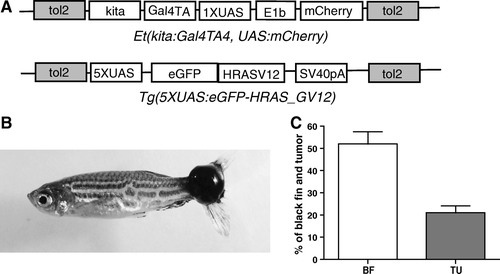
(A) Schematic representation of the constructs used for the generation of the enhancer trap line Et(kita:GalTA4,UAS:mCherry)hzm1 and Tg(UAS:eGFP-HRAS_G12V)io6 line. (B) A 5-month-old transgenic fish displaying a large black tumor in the stalk of the caudal fin. (C) Quantification of the number of fish displaying a black fin (BF) phenotype and tumor (TU) at 4 months (mean + standard deviation, n = 150). |
Expression Data
Expression Detail
Antibody Labeling
Phenotype Data
| Fish: | |
|---|---|
| Observed In: | |
| Stage Range: | Days 21-29 to Adult |
Phenotype Detail
Acknowledgments
This image is the copyrighted work of the attributed author or publisher, and
ZFIN has permission only to display this image to its users.
Additional permissions should be obtained from the applicable author or publisher of the image.
Full text @ Zebrafish