|
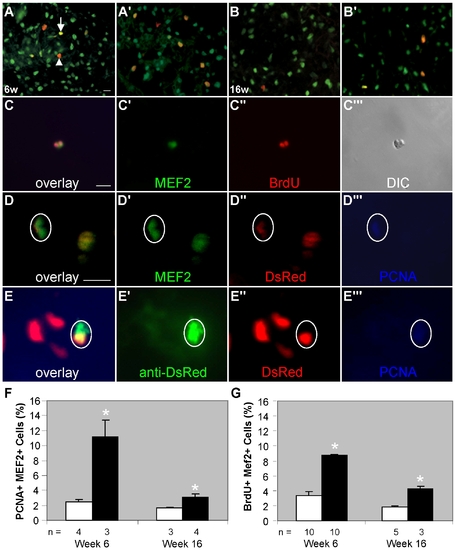
Myocyte hyperplasia contributes to all stages of cardiac remodeling in tr265/tr265. (A–B′) Overlay of proliferating cell nuclear antigen (PCNA) antibody (red) with MEF2 antibody (green) in 10-μm sections of week-6 and -16 (A,B) sibling and (A′,B′) tr265/tr265 ventricles to show proliferating cardiomyocyte-lineage cells (yellow overlay; arrow) and proliferation of other cells (red overlay; arrowhead); bar = 50 μm. (C–C″′) Example of recently divided cells of the cardiomyocyte lineage (green) detected with BrdU antibody (red); bar = 10 μm. (D–D″′) Example of a proliferating mature cardiomyocyte (encircled) from a tr265/tr265 Tg(cmlc2:nuDsRed) mutant fish expressing DsRed, MEF2, and PCNA in its nucleus; bar = 10 μm. (E–E″′) Proliferating cardiomyocytes (encircled) derived from a cardiac progenitor cell in tr265/tr265 Tg(cmlc2:nuDsRed) transgenic fish containing unfolded DsRed in its cytoplasm and DsRed and PCNA in its nucleus. (F,G) Ratio of (F) PCNA+ MEF2+ cells over total MEF2+ cells or (G) BrdU+ MEF2+ cells over total MEF2+ cells in ventricles of week-6 and-16 sibling and tr265/tr265 fish, given as a percent; mean±SEM; * = P<0.05; n = number of fish examined.
|