
Fig. 4
- ID
- ZDB-FIG-090617-8
- Publication
- Zhou et al., 2009 - Molecular cloning and expression of phospholipase C epsilon 1 in zebrafish
- Other Figures
- All Figure Page
- Back to All Figure Page
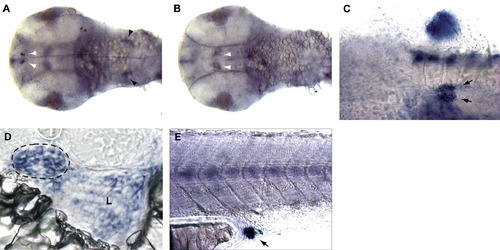
Expression of plce1 at 48 hpf. (A) Dorsal view of the head region showing plce1 expression in two groups of cells (white arrowheads) at the dorsal forebrain flanking the pineal gland and two groups of cells (black arrowheads) in the hindbrain. (B) Ventral view of the head region showing plce1 expression in two groups of cells in the ventral midbrain. (C) Ventral view of the trunk showing plce1 expression in two developing pronephric glomeruli (arrows) prior to complete fusion and the pectoral fin bud. (D) Transverse section showing plce1 expression in pronephric glomeruli (dashed circle) and liver (L). (E) Lateral view showing plce1 expression in the somites (particularly the horizontal myoseptum) and the cloaca (arrow). |
| Gene: | |
|---|---|
| Fish: | |
| Anatomical Terms: | |
| Stage: | Long-pec |
Reprinted from Gene expression patterns : GEP, 9(5), Zhou, W., and Hildebrandt, F., Molecular cloning and expression of phospholipase C epsilon 1 in zebrafish, 282-288, Copyright (2009) with permission from Elsevier. Full text @ Gene Expr. Patterns