
Fig. 1
- ID
- ZDB-FIG-090519-15
- Publication
- Kitambi et al., 2009 - Small molecule screen for compounds that affect vascular development in the zebrafish retina
- Other Figures
- All Figure Page
- Back to All Figure Page
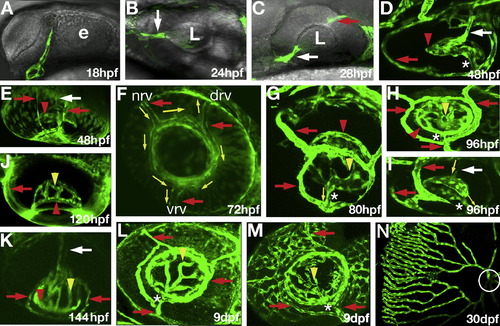
Early development of retinal vasculature in zebrafish. Confocal images of GFP expression in the eyes of fli1:EGFP (B, E, F, J, and K) and flk1:GFP (A, C, D, G, H, I, L, M, and N) transgenic zebrafish. The retinal artery or its presumptive primordium are indicated by white arrows. Red arrows point to the surface vasculature. Red arrowheads indicate the intraocular ring vessel. Yellow arrowheads indicate the intraocular vessel network, whereas the connection between the intraocular and surface vessels is indicated by asterisks. Yellow arrows show the direction of blood flow. (A) GFP-expressing cells are absent the eye at 18 hpf. (B) GFP-positive cells are seen in the retina by 24 hpf (B, white arrow). (C) By 28 hpf, GFP-positive cells are seen in the choroid fissure (white arrow), behind the lens, and in the posterior grove (red arrow). (D and E) By 48 hpf, GFP-positive cells form a network of vessels around the medial side of the lens, annular collection duct (asterisk) is established, and surface vessels are differentiated. Retinal blood flow is present by 72 hpf. (F) In the surface vasculature, blood enters through the nasal vessel (nrv) and exits through the dorsal (drv) and ventral (vrv) vessels. (G–I) Blood from the intraocular vasculature flows through the annular collection duct (asterisks) into the surface vessels. (J and K) Intraocular vessels gradually rearrange to form a roughly radial array by 144 hpf. (L) Intraocular and surface vasculatures at 9 dpf. (M) Choriodal vessels form a network on the outer surface of the eye at 9 dpf. (N) The eye vasculature at 30 dpf. Circle indicates the optic disc region. The retina was dissected and mounted on a flat surface to obtain this image. e, optic lobe; L, lens. In (A–M) anterior is left. In (A–C, G, H, L, F, M, and N) dorsal is up. Panels (A–C, F, H, L, and M) show roughly the lateral view of the eye. Panels (D, E, I, J, and K) show ventral view of the eye. |
| Genes: | |
|---|---|
| Fish: | |
| Anatomical Terms: | |
| Stage Range: | 14-19 somites to Days 30-44 |
Reprinted from Mechanisms of Development, 126(5-6), Kitambi, S.S., McCulloch, K.J., Peterson, R.T., and Malicki, J.J., Small molecule screen for compounds that affect vascular development in the zebrafish retina, 464-477, Copyright (2009) with permission from Elsevier. Full text @ Mech. Dev.