
FIGURE
Fig. 6
- ID
- ZDB-FIG-090408-96
- Publication
- Shima et al., 2009 - The characterization of a zebrafish mid-hindbrain mutant, mid-hindbrain gone (mgo)
- Other Figures
- All Figure Page
- Back to All Figure Page
Fig. 6
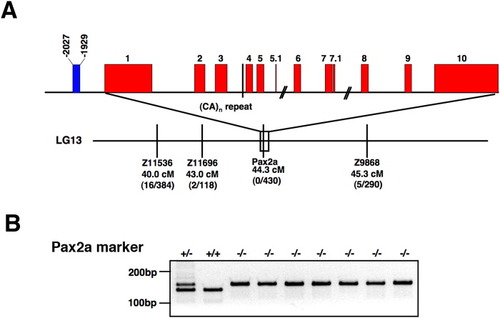
Genetic mapping of mgo. A: Genomic structure of the pax2a gene and SSLP markers around the Pax2a locus. The CA marker in intron 3 is indicated by the line on the genome structure. The markers, the distances, the number of recombination events, and the number of meiosis tested are shown. The putative enhancer region is indicated by a blue box. Nucleotide positions are shown relating to the transcription start site. B: Genotype analysis of single embryos with a marker in the pax2a gene. Genotypes are indicated by + (wild type, WIK) and - (mutant, AB*). |
Expression Data
Expression Detail
Antibody Labeling
Phenotype Data
Phenotype Detail
Acknowledgments
This image is the copyrighted work of the attributed author or publisher, and
ZFIN has permission only to display this image to its users.
Additional permissions should be obtained from the applicable author or publisher of the image.
Full text @ Dev. Dyn.