
Fig. 1
- ID
- ZDB-FIG-090223-15
- Publication
- McGaughey et al., 2009 - Asymmetrical distribution of non-conserved regulatory sequences at PHOX2B is reflected at the ENCODE loci and illuminates a possible genome-wide trend
- Other Figures
- All Figure Page
- Back to All Figure Page
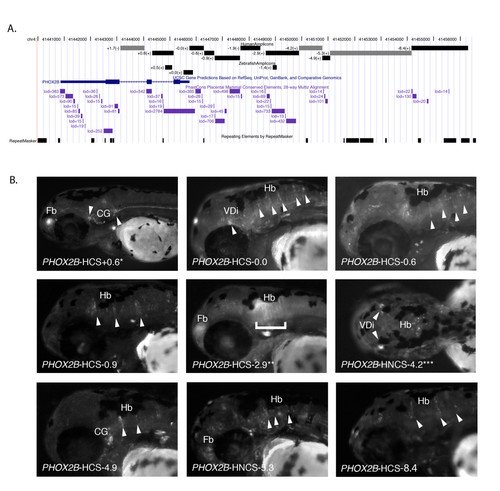
Conserved and non-conserved amplicons tiled across the PHOX2B proximal region direct PHOX2B appropriate expression. (a) The human PHOX2B promoter proximal region (chr4:41,440,000–41,456,600; hg18) was divided into 11 amplicons (total size 11,965 base pairs) excluding exons, 5′ UTR, and 3′ UTR, according to whether intervals contained PhastCons Placental Mammal Conserved Elements, 28-way Multiz Alignment sequences [41]. The amplicons are represented as gray scale rectangles: black (PHOX2B-HCS); gray (PHOX2B-HNCS); black (zebrafish alignment). Amplicon names are defined by their distance from the PHOX2B transcriptional start site and are displayed as custom tracks on the UCSC Genome browser http://genome.ucsc.edu[54] (b) Lateral images of G0 48-hpf zebrafish embryos exhibiting PHOX2B appropriate expression with element name marked on picture. Fb, Forebrain; VDi, Ventral Diencephalon; Hb, Hindbrain; CG, Cranial Ganglia; SC, Spinal Cord; ENS, Enteric Nervous System. *G1 embryo at 72-hpf. **G1 embryo at 48-hpf. *** Dorsal photo. |