
Fig. 5
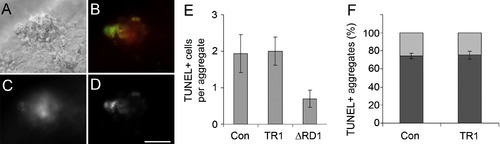
TNF Signaling Does Not Influence the Rate of Apoptosis of Infected Cells DIC and fluorescent imaging of a granuloma are shown in (A) and (B)–(D), respectively. (B) shows colocalization of TNF expression (red) and TUNEL-labeled double-strand DNA breaks (green). Individual fluorescence channels for (C) TNF expression and (D) TUNEL-labeling are shown. The scale bar represents 50 μm. (E) shows the number of TUNEL-positive cells per granuloma ± standard deviation of the mean. The average number of TUNEL-positive cells within granulomas in 4 dpi embryos is unchanged between control (n = 16 granulomas) and TR1 morphant embryos (n = 20). Infection of control embryos with RD1-deficient bacteria (ΔRD1) is used as a control (n = 20). The number of TUNEL-positive cells in ΔRD1 granulomas is significantly less than control and TR1 morphant granulomas with wild-type bacteria (p < 0.05 by Student's unpaired t test for both comparisons). Granulomas were selected to be between 40 and 50 μm in diameter to normalize for total cell number. (F) shows the percentage of TUNEL-positive granulomas between control and TR1 morphant 4 dpi embryos ± standard error of the mean. Three separate experiments of pools of 20–40 granulomas were scored per condition and plotted as number of granulomas with TUNEL-positive cells over total granuloma number. Error bars represent standard error of the mean. |
| Fish: | |
|---|---|
| Condition: | |
| Knockdown Reagents: | |
| Observed In: | |
| Stage: | Day 5 |
Reprinted from Immunity, 29(2), Clay, H., Volkman, H.E., and Ramakrishnan, L., Tumor necrosis factor signaling mediates resistance to mycobacteria by inhibiting bacterial growth and macrophage death, 283-294, Copyright (2008) with permission from Elsevier. Full text @ Immunity